Solar Panels in Mosman, Kings Langley, Marsden Park and Oran Park

A Comparative Analysis of Sydney Suburbs with Solar Photovoltaic Roof Panels

Geoscape Solar reveals higher solar uptake in newer Sydney suburbs.

Published 05 Jul, 2022

When it comes to renewable energy, Australia is known as the sunniest continent with the highest solar radiation per square meter.


Recently, more and more people are moving toward renewable energy sources not only to have reduced electricity bills but also to move towards a sustainable future. As per a recent report by the Australian Energy Council, among the different states of Australia, NSW has been leading the way, with more than 116,000 solar rooftop PV systems installed in 2021 and 965 MW of capacity added to household rooftops.

Our findings

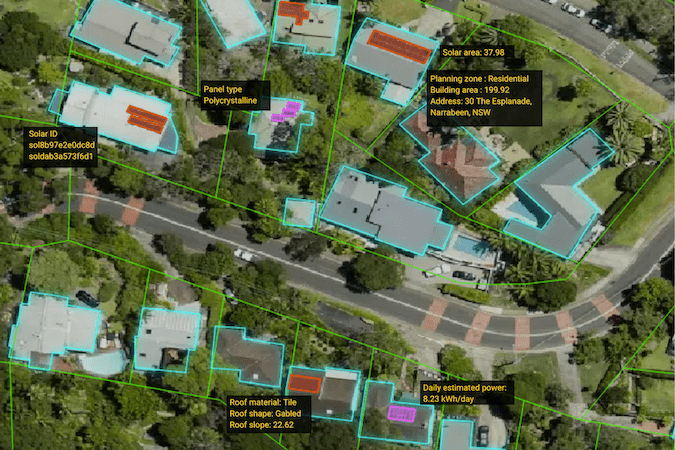
With the recent launch of Geoscape Solar, we decided to use our data to analyse solar installations, particularly between the more established suburbs and the newer ones.

The suburbs were Mosman, Kings Langley, Marsden Park and Oran Park.

Mosman and Kings Langley are the established suburbs, and Marsden Park and Oran Park are both relatively new as Oran Park developed rapidly with a population that has grown from 0–7500 in 8 years.
Detailed analysis

image
image
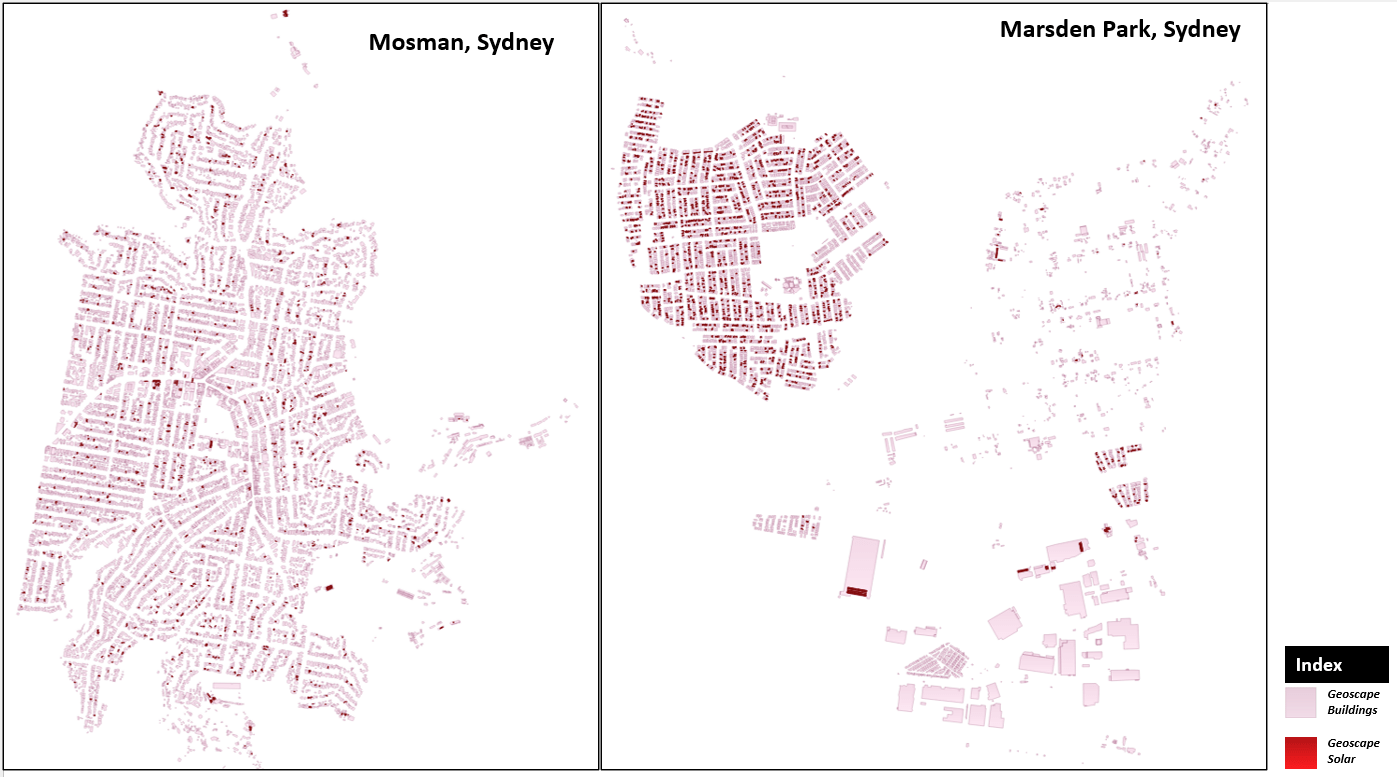
Spatial visualisation of buildings and solar panels indicates a higher density of PV solar panels in Marsden Park, compared to Mosman

Mosman
(NE Sydney)
Kings Langley
(NW Sydney)
Oran Park
(Sydney SW)
Marsden Park
(NW Sydney)
Suburb AgeEstablishedEstablishedNewerNewer
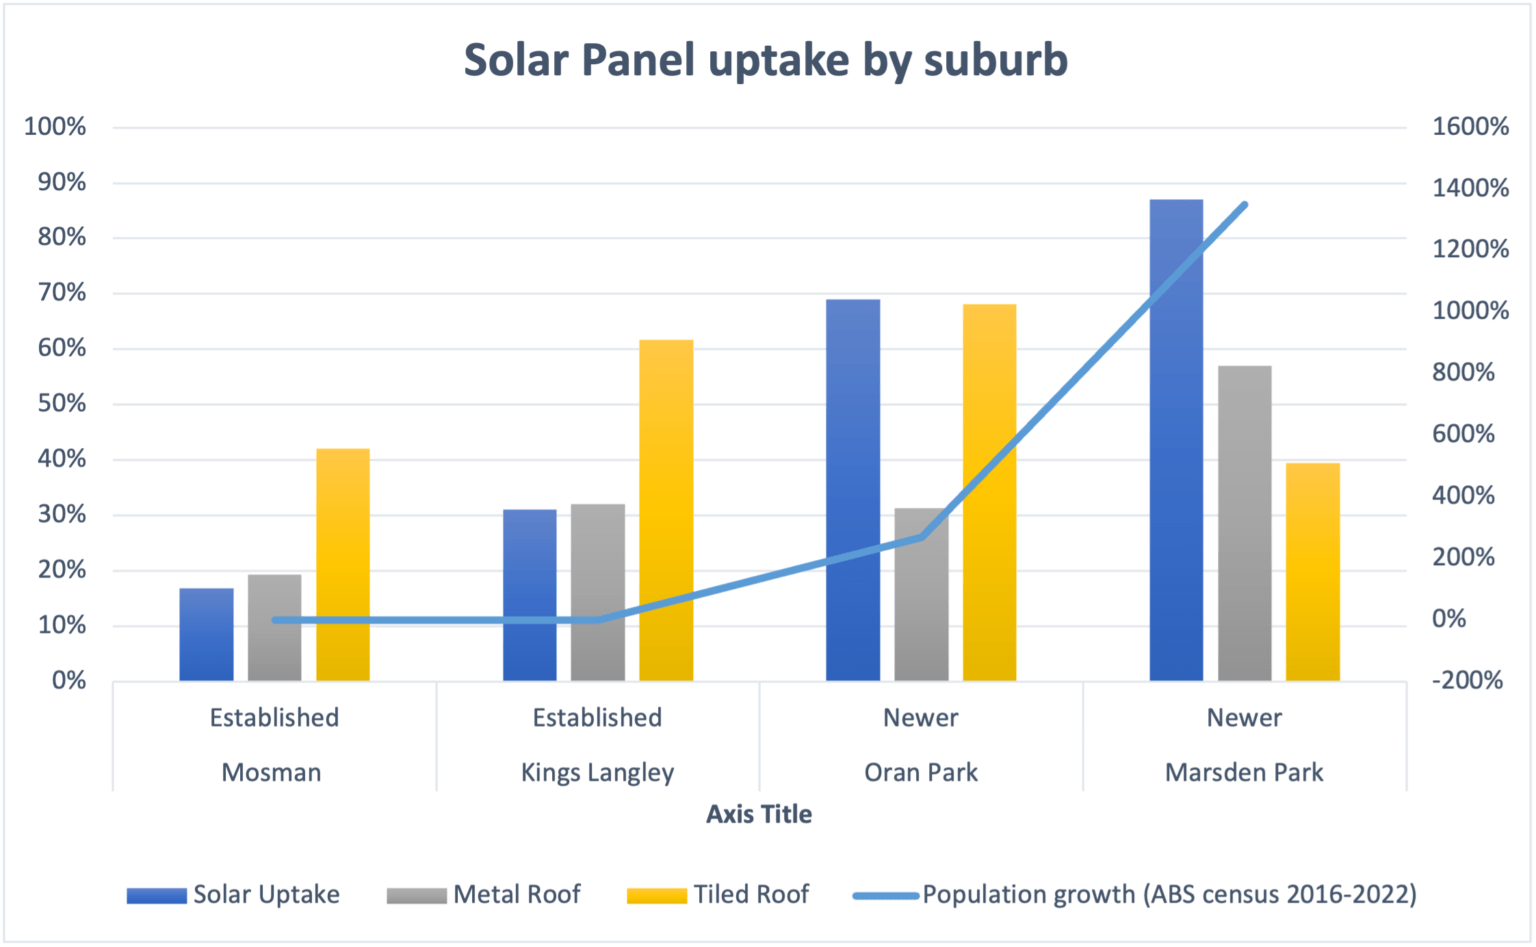
Solar Uptake16.8%31%69%87%
% of Polycrystalline Panels
(used instead of  Monocrystalline
and Thin-film)
76%87%89%82%
Metal Roof19.37%32.05%31.27%57%
Tiled Roof42.09%32.05%31.27%57%
Other kinds of roofFlat concrete 37%
Fibreglass 1.26%
Flat concrete 5.22%
Fibreglass
0.98%
Fibreglass 0.55%Flat concrete 2.7%
Fibreglass
0.4%
Populations growth
(ABS Census 2016-2022)
-0.5%0.01%269%1349%
Comparison Chart
image
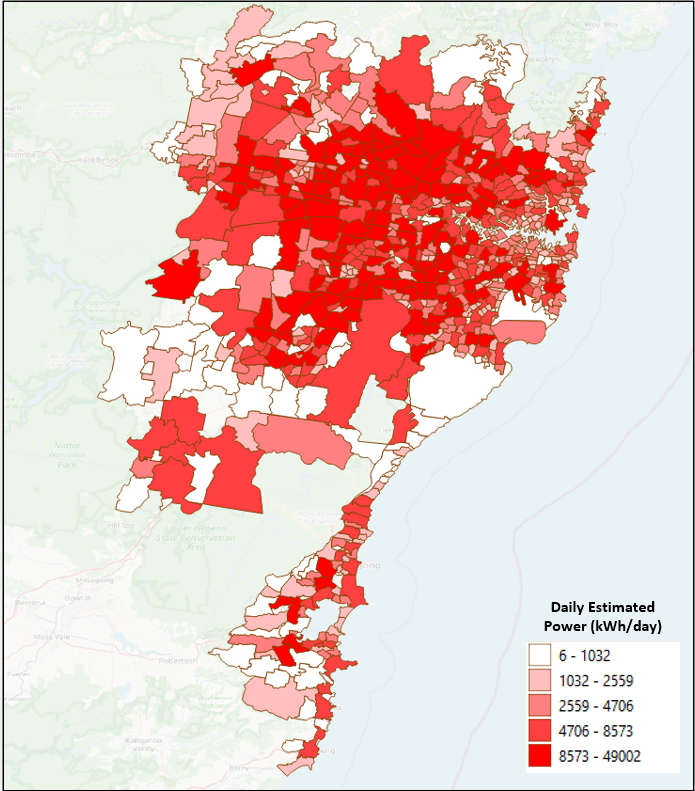
Sydney suburbs show varying daily estimated power (kWh/day). The data was derived by summing up the daily estimated power (Kwh/day) of all buildings in each suburb.
image
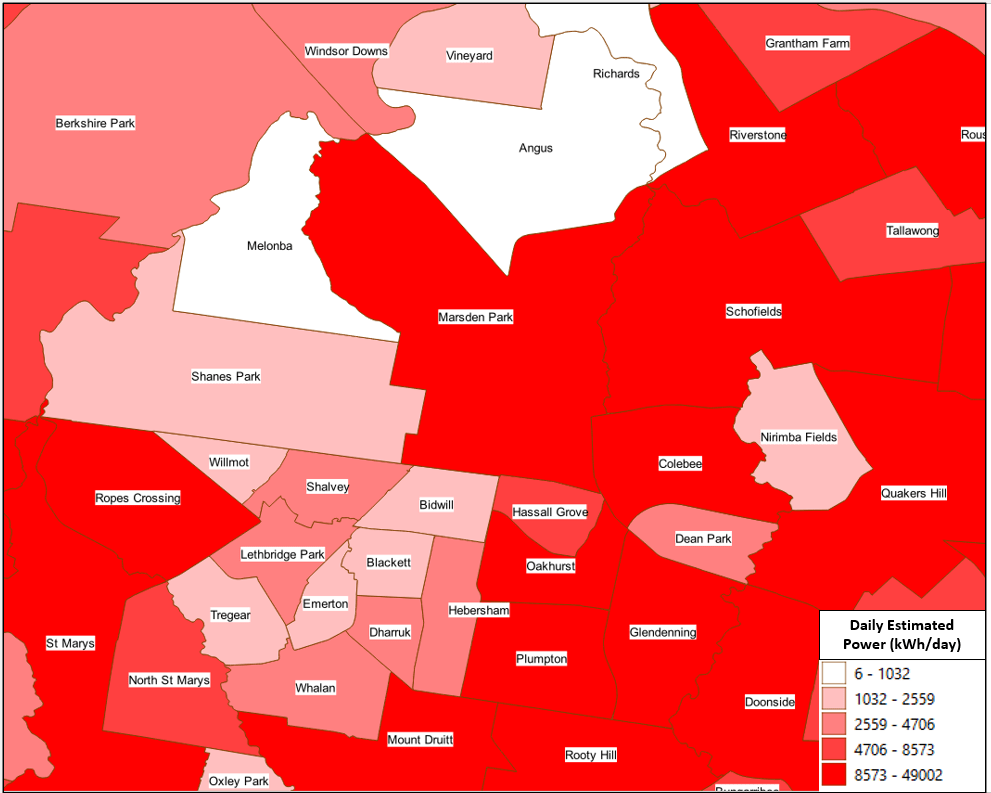
A closer look at a few Western Sydney suburbs; Marsden Park, Schofields, and Quaker Hills show higher daily estimated power compared to adjoining suburbs like Melonba (developing site), Shanes Park, Wilmot, Bidwill, Vineyard

Can population growth be a factor for solar uptake?  Looking at the data, it seems it is.  A bigger population means more new housing, and it looks like more and more new houses are moving towards solar adaptability, a trend that can benefit us all.

Though our sample area of study was relatively small, and more variables influence solar trend, Geoscape data can be combined with census data to derive further insights.  We will soon use our data to understand solar adoption at the state level and share our findings.

Geoscape Buildings is a continually updated dataset comprising over 16 million buildings derived from satellite and aerial imagery. It provides information like height, roof material, planning zone, estimated floor levels and more, while Geoscape Solar provides access to photovoltaic solar panels around Australia. The dataset is captured via high-resolution aerial images using artificial intelligence (AI) technology.


Author: Tithi Roy, Pre-Sales Consultant Geoscape Australia

Get in touch

Let’s discuss what you can achieve with location intelligence

Contact us