Planning Insights overlay

The Power of Geoscape Planning Insights Overlays Table: What You Need to Know

Six overlays enhancing land planning across industries in Australia.

Published 01 May, 2023

We recently launched our Geoscape Planning Insights, an aggregated and enhanced planning data solution that provides information about the development potential of land across Australia.

Did you know Geoscape Planning Insights has 6 different types of overlays to help you identify if a cadastre parcel or address has any additional planning controls? In this blog, we’ll share information about those overlays and how they can be relevant to specific industries.

What is in the Geoscape Planning Insights Overlays table?

Every cadastre parcel or address will have a “flag” for whether it lies within a bushfire, flood, infrastructure, heritage, industry or environment overlay.

    • bushfire overlay may label a cadastre parcel or address as “bushfire-prone land” and describe whether it is classified as ‘Vegetation Category 1, 2, or 3’. Or a bushfire overlay may identify a parcel as ‘emergency management’, describing it as “a bushfire management overlay (BMO)” which means you may require a planning permit to build or extend dwellings at this parcel.

    • flood overlay will typically indicate flood hazards at a cadastre parcel or address. For example, local governments classify areas as “1 in 100 (1%) AEP Floodplain Development Control Area” to show where development controls may be applied to ensure an adequate level of flood protection is provided to the proposed development. Flood overlays can also identify where approval is required from the local water utility provider.

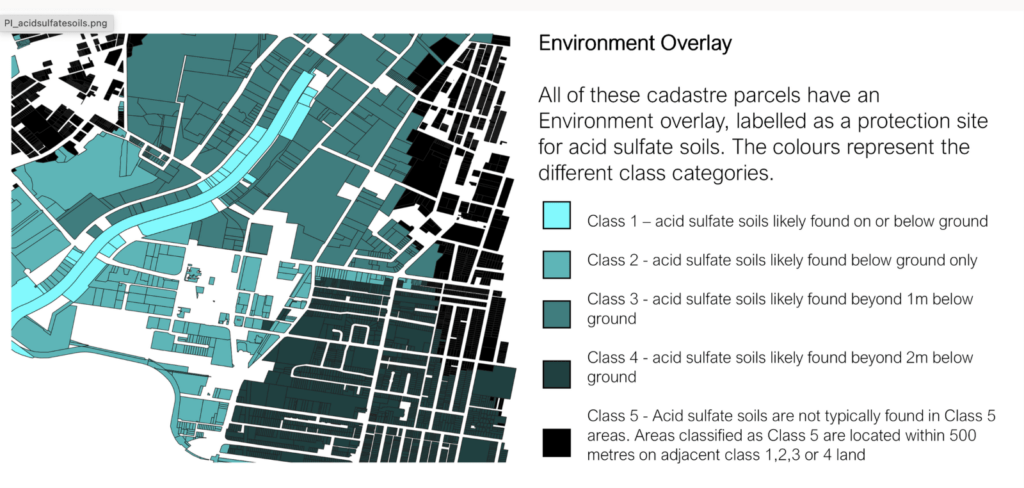
    • The environment overlay identifies all sorts of overlays ranging from landslide hazard areas (moderate, high or very high hazard), areas of acid sulfate soils (Classes 1, 2, 3, 4 5), wetlands, koala protection areas, fire ant biosecurity zones, waterways and many more.
image
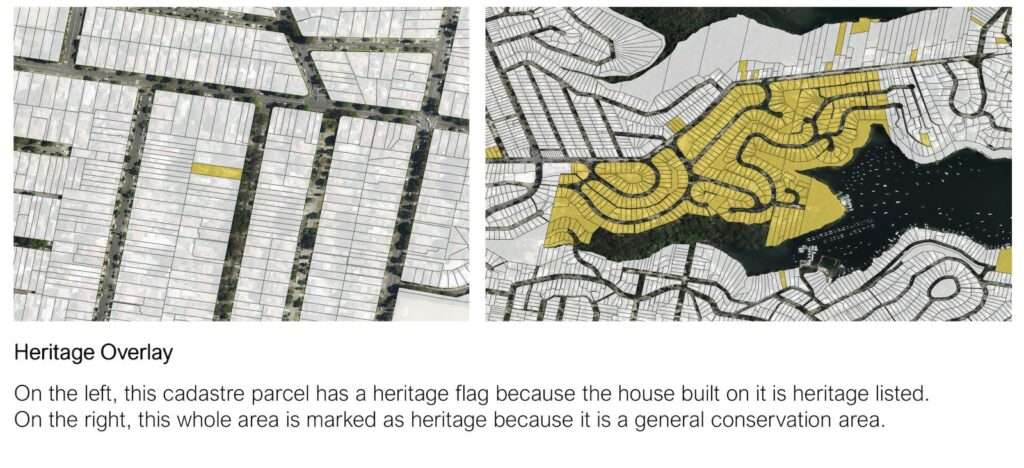
  • The heritage overlay will mark out heritage-listed areas. These can be large areas spanning across multiple land parcels, such as the “Bathurst Heritage Conservation Area” or “Aboriginal Cultural Heritage Sensitivity Areas”. Alternatively, they could refer to individual locations of heritage such as “Hayward Cottage” or “Sydney Opera House”.
image
Heritage Overlay
  • Infrastructure overlays* identify where there may be special considerations for surrounding critical infrastructure projects or plans. For example, areas with “airport environs” overlays may have development limitations to make sure it does not impact the safe and efficient operations of airports. Similarly, a group of land parcels may have an overlay where it intersects with a “light rail urban renewal” plan as a transition area, frame area or primary focus area.
  • An industry overlay* can highlight where there are extractive resource activities, including separation, processing or transport routes. It can also highlight agriculture land interface areas.

In addition to the six main categories mentioned earlier, there are other overlays that don’t fit into these categories. For example, there are overlays that show the location of mines and easements information, such as cable, access, absorption, construction, dam, drainage, pipeline, electricity, powerlines, and so on.

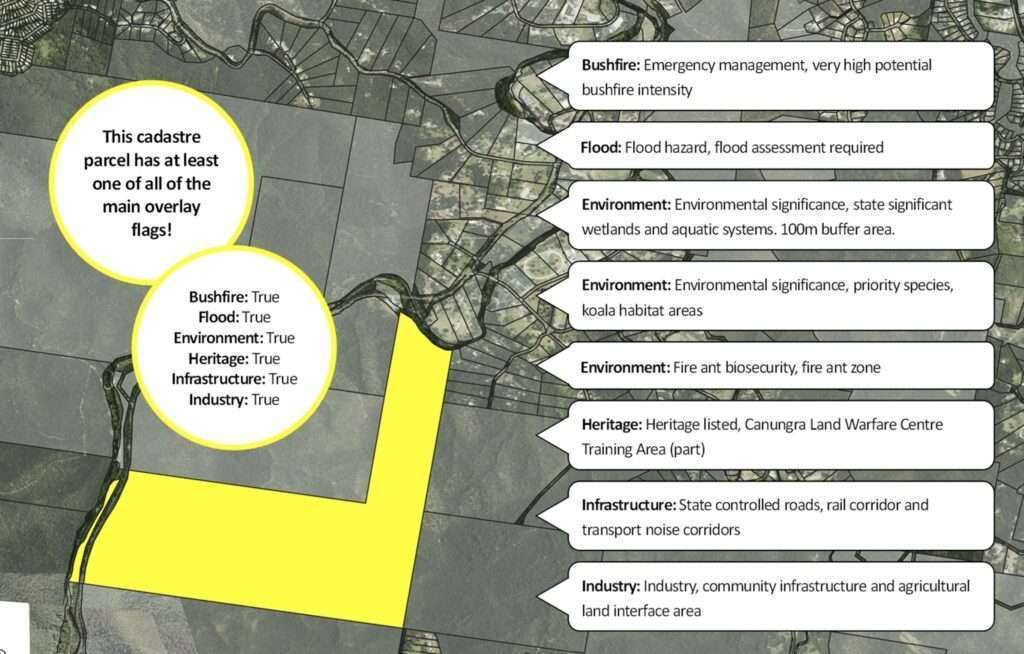
Fun fact – Some cadastre parcels can have overlays from all of the above main categories. For example, the image below near Mount Tamborine in Queensland, Australia, shows overlays for bushfire, flood, infrastructure, heritage, environment, and industry.

image
Cadastre parcel near Mount Tamborine in Queensland, Australia with main overlays

How is Overlay information used across various verticals?

Not only do the overlays give an indication of natural risk, but they can also provide insight into what development controls are present at sites of interest and how that may impact population planning projects.

For government officials, having access to the Planning Insights Overlays table can be extremely useful for population planning purposes. Understanding population growth in the context of where there is fire, flood, or other environmental hazards can be critical when planning new policies, urban development and delivery of energy, services and infrastructure. Since Planning Insights overlays is a national data solution, there’s no need to acquire and aggregate overlay data from each individual local government or jurisdiction.

If you’re in the PropTech industry, then you might be interested in Planning Insights Overlay information to understand fire, flood or other environmental risks to your property portfolio, as this can help to inform the pricing and valuation of properties.

Architecture, engineering and construction professionals can understand any potential site risks or sensitivities by having the details of any bushfires, floods, infrastructure, heritage or industry overlays that intersect with the land parcel of the site development. This can help inform whether additional planning permissions are required to build on the site.

Having access to Planning Insights Overlay information can help telecommunications and utilities professionals make informed decisions when it comes to selecting new asset sites or protecting existing assets. If an overlay indicates that a particular location is at a higher risk of bushfires, then appropriate preventive measures can be put in place to protect the asset from fire damage. Similarly, if an overlay indicates the presence of heritage sites, then the construction or maintenance of new assets may need to be modified or planned in a way that considers the heritage value of the area.

If you’re in the banking and insurance industry, then you may be interested in understanding which properties within your portfolio are at higher risk of environmental hazards or have special heritage value. This can help with informing rebuild costs of properties within your portfolio.

Interested in learning more about Planning Insights, book a demo with one of our experts.

Authored by
Esther van Praag
Pre-sales Consultant, Geoscape Australia 

Images in this blog were created using aerial imagery © Aerometrex Ltd 2023, and Geoscape Planning Insights © Geoscape Australia 2023 Copyright and Disclaimer Notice.

*Infrastructure and Industry Overlays only apply to Queensland, Australia.

Custom solutions

Our expert team can enhance and enrich Geoscape’s datasets to meet your organisation’s needs

Talk to us