Geoscape Solar can help you plan, locate, design, sell, assess or monitor solar panels across urban areas in each state and territory of Australia.
Underwriting insurance, forecasting energy use, marketing solar panels, or developing government policy for the burgeoning renewables industry? Geoscape Solar can help.
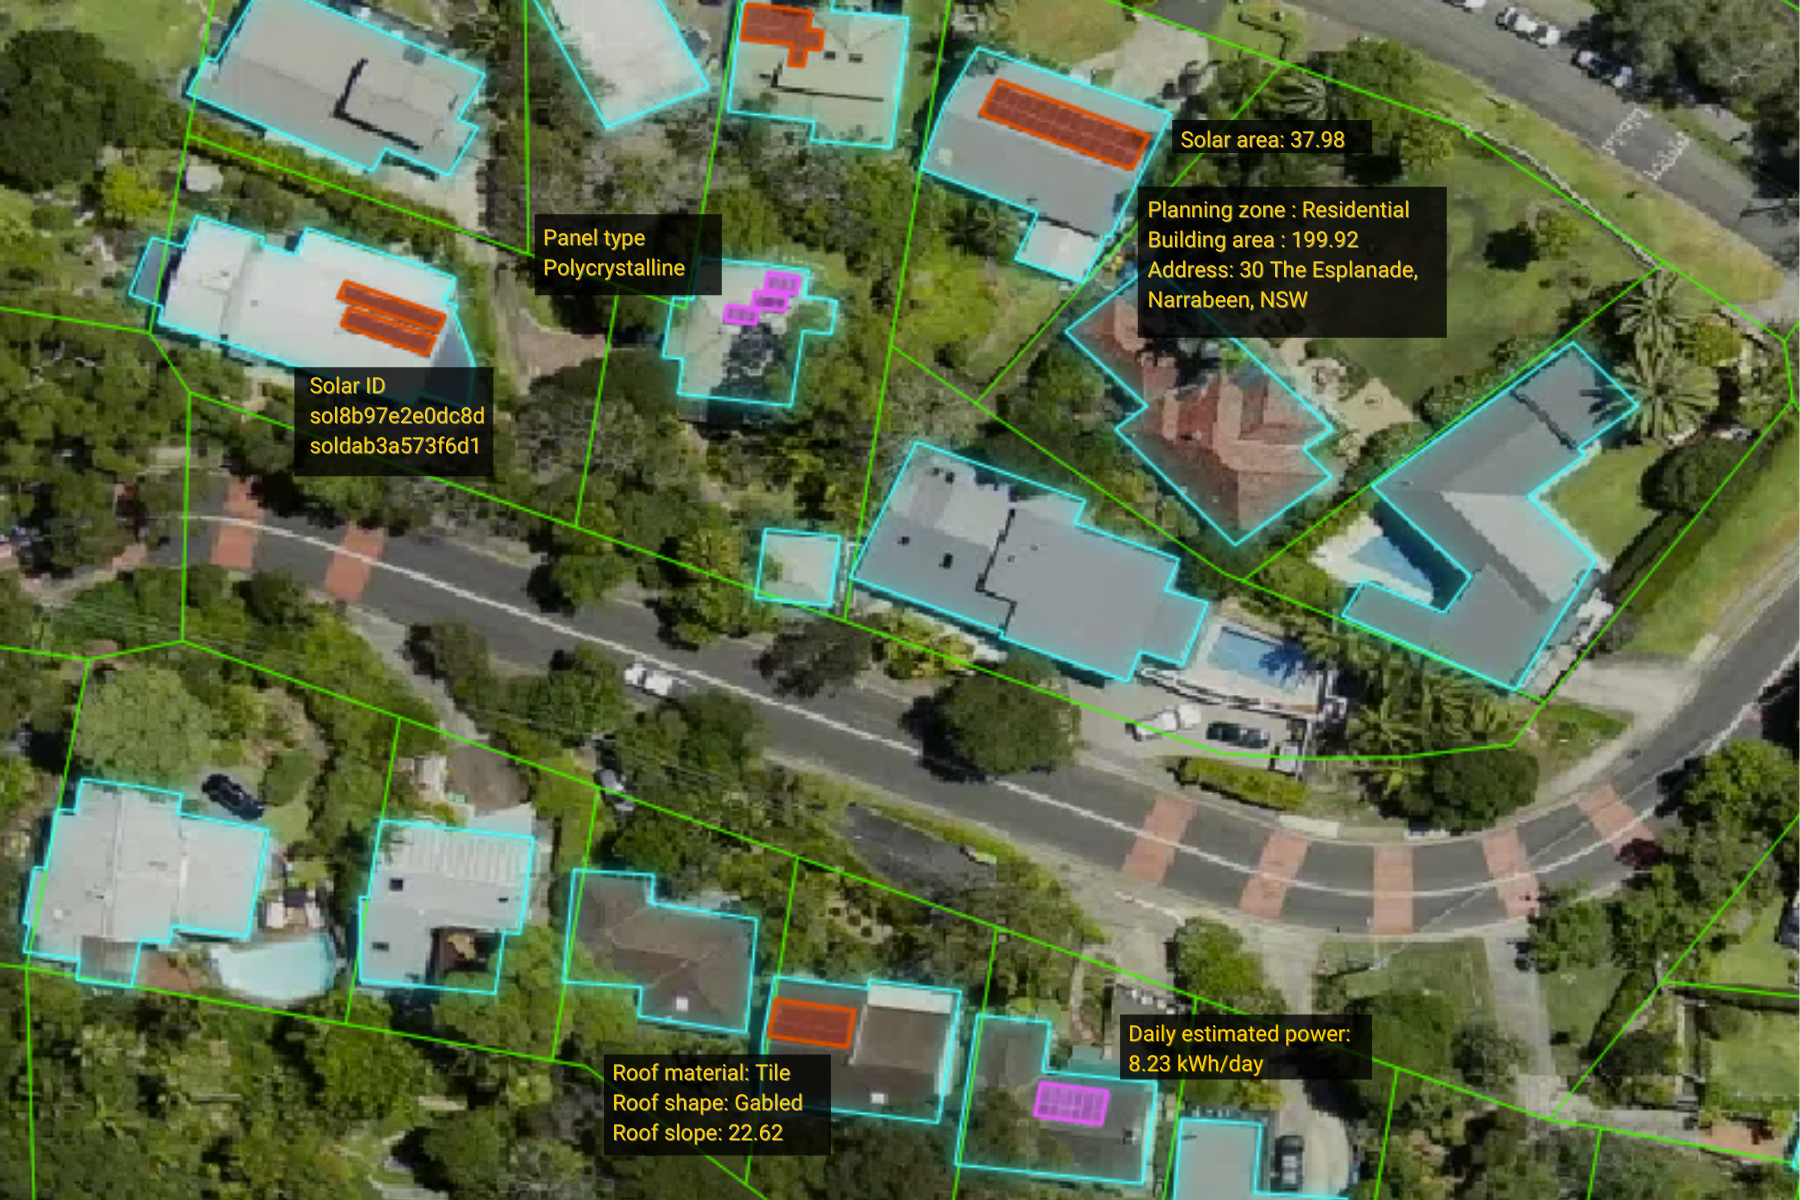
Geoscape Solar gives you access to photovoltaic solar panels around Australia. The dataset is captured via high-resolution aerial images, using artificial intelligence (AI) technology.
With Geoscape Solar you get information for the exact area measurement of the solar panels on a building and an estimate of their power generation capacity.
By working with the provider of national datasets, you can shape your solutions and make your data sourcing more efficient.
Geoscape Solar Features
- Exact measurement of the area of all the solar panels on a building.
- Estimate a solar panel’s capacity on an average day, in kilowatt hours.
- Integrates directly with G-NAF to offer insights at an address level.
- Solar panel data is recaptured and updated regularly.
- Identify up to three types of solar polygons on a building – Monocrystalline, Polycrystalline and Thin-film.
- Learn about a building’s roof shape and roof material.
Download Geoscape Solar datasheet
View Geoscape Solar product guide
*The code that unzips the sample data file can be found in the evaluation agreement available in the link.
Ready to use Geoscape Solar today?
Full Dataset
Get access to full dataset in various file formats
- File Geodatabase
- GeoJSON
- ESRI Shapefile
- MapInfoTAB
Solar API
Start with our Freemium offer, a great way to experience the quality of our Solar API on a ‘Try before you buy’ basis.
Every Freemium customer gets 20,000 free credits that can be used for solar APIs.
Custom Data Solution
Geoscape Solar can be made available as a custom data solution.
For a more customised data offering.
Geoscape Solar Use Cases
Insurance
Underwriters can see the solar panels, to better understand the associated risk and calculate a premium. Geoscape Solar offers an overview of solar panels in a particular area and hence big picture exposure to property insurance claims. Date stamped data can assist in countering fraud.
Energy Analytics and Modelling
Energy profiles vary across buildings. Geoscape Solar allows modelling of power consumption, so forecasting demand and usage is easier. Information around panel, address and roof area makes it possible to also calculate a building’s potential to generate energy.
Marketing Analytics
Targeted residential marketing campaigns to optimise customer acquisition is easier with Geoscape Solar to locate solar-free houses and pinpoint residents. Marketers can even use our data to find existing solar panel customers and offer solar panel upgrades or upsell companion products like inverters and batteries.
Government
Our data can be used by governments developing renewable energy policy, measuring uptake, monitoring its impact and promoting the success of government initiatives. Geoscape Solar may also inform planning; helping governments who are developing models of commercial and residential buildings to understand energy consumption and generation, and the factors impacting these.
FAQ
- Monocrystalline – made from a single pure silicon crystal that is cut into several wafers to be used for the panel’s cells. These panels are dark-black with minimal edging around them.
- Polycrystalline – made from multiple silicon crystals. These panels are generally blue and have thick white edging.
- Thin-film – made by depositing thin layers of photovoltaic material (made of silicon, cadmium, copper and other elements) on a substrate to create a solar cell. These panels can be flexible or rigid and do not have edging.
Our AI partner analyses differences in texture and colour in the imagery, to identify the three solar panel types.
Generally, solar panels aren’t placed under trees or anything else that might cover them. We work within the limitations of remote sensing but, we have ways to estimate the shape of features that are partially obscured.
We consider several factors such as panel type and size, and climate.
Geoscape Solar covers urban areas in every Australian state and territory.
Concern about the impact of environmental change has emerged as a recurring theme in the last decade. To combat the consequences of climate change, numerous governments and industries have committed to achieving net-zero emissions by 2050, and a critical part of this transformation is the shift to renewable energy.
With Australia being a sunny country, it’s no wonder that solar power is leading the charge for renewable energy in 2022. Clean Energy Australia has recently reported that we’ve reached a significant milestone where rooftop solar now accounts for more than a quarter of Australia’s total renewable generation for the first time*.
As we continue towards a net-zero Australia, the importance of location data will continue to play a critical role in reporting on progress, enabling educated decision-making, and powering good government. Access to solar panel location data can enable a wide range of analysis that brings us closer to achieving our goal.
* Source: ‘Clean Energy Australia Report 2023’, Clean Energy Council, April 2023.
Access to solar panel location data opens a wide range of possible data analysis.
Solar Energy Planning: Solar data aids in determining a location’s potential for solar energy generation. Knowing whether a location already has solar panels, what type of panels, and how many panels can aid in the planning of solar panels installations and upgrades. In combination with solar irradiance data, analysis can be conducted to identify optimal locations for solar panel installation for maximised solar energy production.
Net-Zero Reporting: When it comes to measuring emissions, it can be difficult to get access to first-party business data on measured energy consumption. By using Geoscape location data, you can baseline a building’s emissions by using information such as the building’s total floor area and the estimated solar energy generation (if there are solar panels present) and report these metrics at an address level. It’s also possible to the physical locations of the addresses and buildings for spatial analysis.
Policy and Government: Solar panel data can be used by Government to report against and inform the development of clean energy policies, such as federal and state solar rebate schemes. By measuring the uptake of rooftop solar installations and comparing to other data trends in the area (for example, relative socio-economic advantage and disadvantage data), models can be built to understand energy consumption and generation, and factors impacting these.
A real case study for where Geoscape data has been used is in the Commercial Building Baseline Study 2022 Report which aimed to answer questions like “How many non-residential buildings are there in Australia”, “How much energy do they use, of what kinds, and for what end-uses?”, and “How much greenhouse gas emissions are they responsible for?”* This report is incredibly beneficial in that it provides high-quality information to support research, planning and policy development in Australia.
* Source: ‘Commercial Building Baseline Study 2022’, Strategy Policy Research (SPR), August 2022
Geoscape’s solar product has many different facets to it, and each approach to how you view the data can lend itself to different types of analysis.
Geometry data: The solar panel dataset is derived from remotely sensed imagery and is produced as a spatial dataset, which means that the outline of the solar panels can be plotted on a map as a . It can also be overlaid on three-dimensional buildings and used in three-dimensional analysis such as shadow analysis. Solar panel geometry is useful for understanding the position and orientation of the solar panel.
Attributes: For each captured solar panel, there is information on the type of solar panel (monocrystalline, polycrystalline, thin-film), the area of the panel (in metres squared), and the daily estimated power of the panel (in kilowatt hours per day). There is also metadata on the capture date and source of the imagery that the solar data was extracted from. This adds that additional layer of intelligence onto any analysis of solar data you are conducting.
Historical data: Geoscape maintains the solar product as a continuous dataset with quarterly releases. You can access historical releases of the data and compare the changes to the solar panel data over time, which means you can conduct analysis to understand trends in uptake or set reporting benchmarks.