Article contents
Introduction
QGIS is a free and open source Geographic Information System (GIS) application. Among its many features, QGIS enables you to create shapefiles. The Geoscape platform accepts shapefiles to define an area, against which you can access the spatial data you need. This article will take you through the basics of QGIS so that you can generate your own shapefiles to use in Geoscape.
Where this article includes references to, for example, QGIS features or GIS terminology, they will be formatted as follows:
Software Features
Terminology
Common problems
1. Download and install QGIS
Visit the download page on QGIS.org.
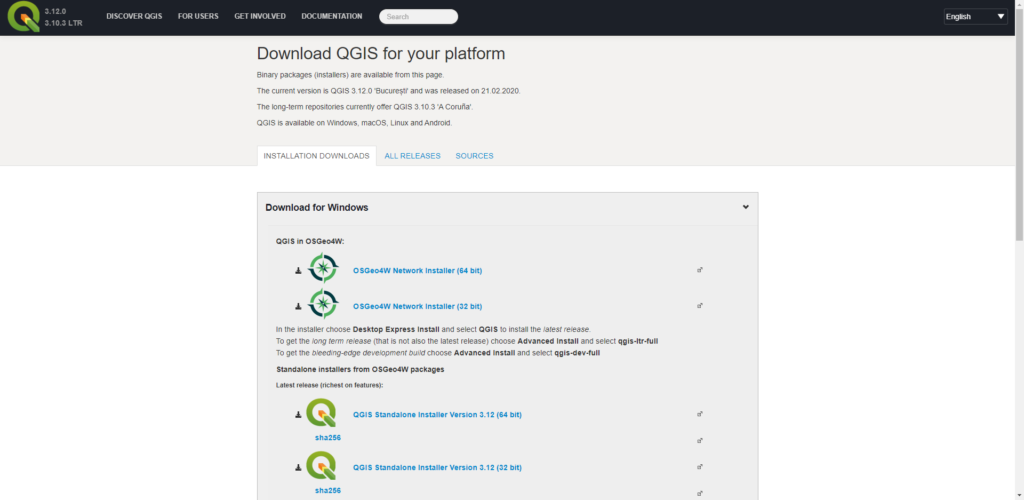
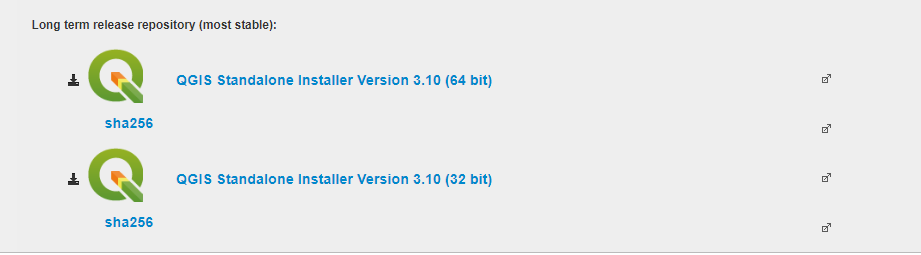
Scroll down the page to Long term release. Depending on your system, select either the 64-bit or 32-bit edition. If in doubt, 32-bit will work.
Once downloaded, open the executable and follow the installation instructions.
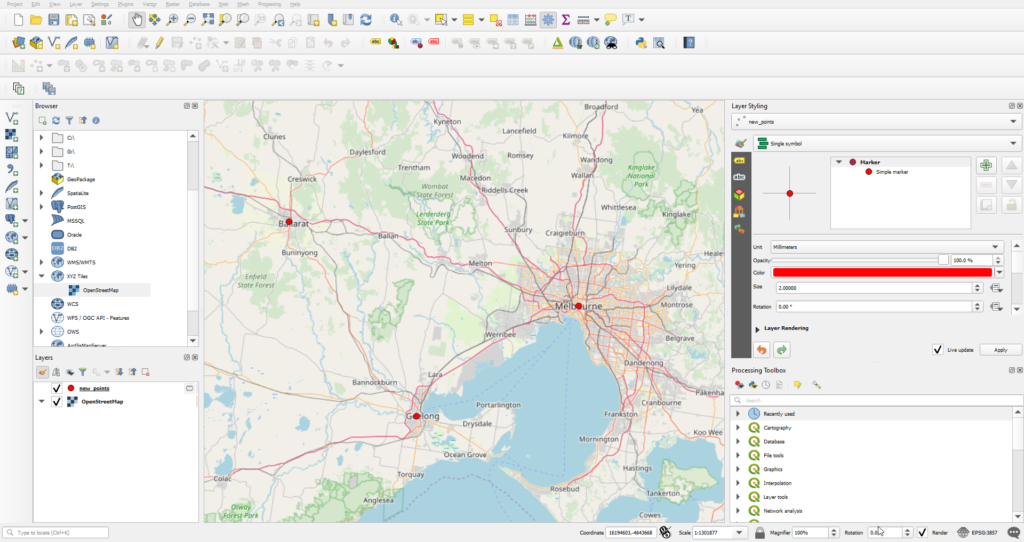
Once installed, you will arrive at the main screen. Click the New Project button in the top left corner of the application window.
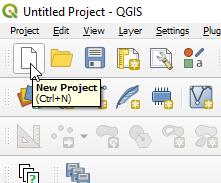
Your screen will look something like this:
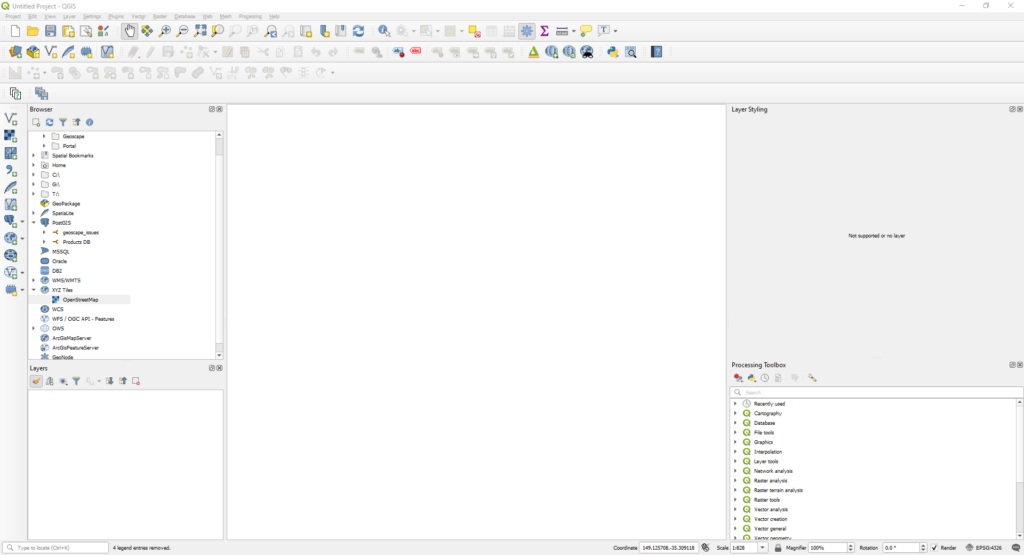
You are on your way to creating a shapefile. The next step is selecting a basemap.
2. Basemaps
A basemap is a collection of images to help orient you to the location you're looking at. Computers will happily work with coordinates alone, but a visual representation gives us some much-needed context.
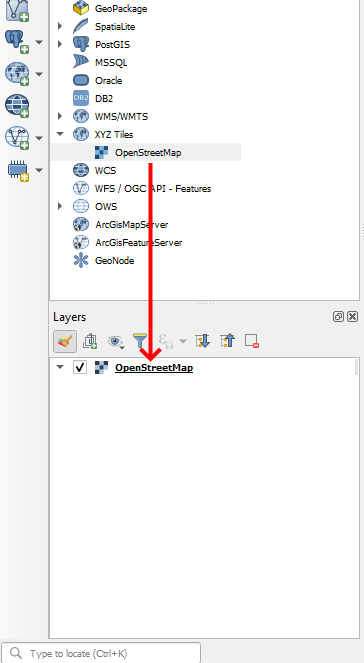
QGIS comes with a default basemap supplied from OpenStreetMap. To use this basemap, inspect the Browser panel in your application window. Click the arrow next to XYZ Tiles, and drag OpenStreetMap down into the Layers panel.

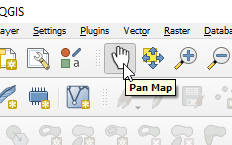
If not already selected, click the Pan Map button from the top toolbar.
You can now move the map around by clicking and dragging your mouse on the basemap, and zoom using the scroll wheel. Hold the Ctrl key while scrolling to zoom more precisely.
3. Layer types
QGIS can use multiple layer types. We introduce them and discuss their differences here.
Next to each layer name in QGIS is an icon which indicates the layer type. We have reproduced the symbols next to the layer names below.
I've used red in my layers for consistency, but for you the icon colours for points, lines and polygons will appear different. QGIS automatically assigns a new colour to each of these layer types when you add them.
Raster 
The OpenStreetMap (OSM) basemap is an example of a raster layer. A raster layer is visual data comprised of pixels and may sometimes be referred to as imagery.
Table 
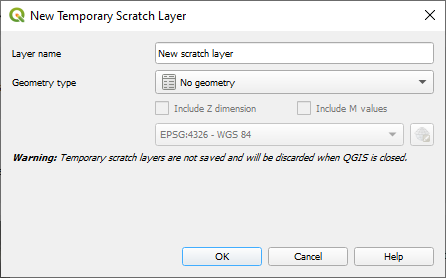
A table contains non-spatial data. An example is a spreadsheet with a list of addresses or coordinates. The data from a table won't show on the map without further processing to display it. It's also referred to as a No geometry layer as shown below:
Point
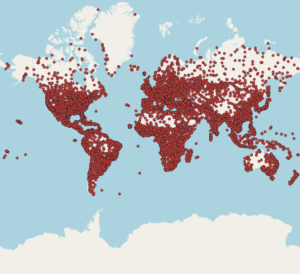
A point layer contains one or more points on the map. A point indicates an exact position, and has no length or width. Point layers are useful for showing the locations of cities, buildings, or other fixed locations. When a point is in the centre of an area, it is the centroid of that area. An example of a point layer is this map showing many cities of the world over the OSM basemap:
Line 
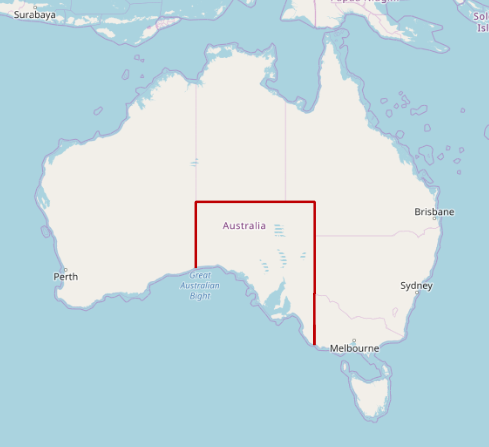
A line layer contains one or more straight line segments, joined by points called vertices (singular: vertex). These lines have only length, but no width. Line layers can be useful for showing roads, train lines, borders, and other cases where tracing something's position is more important than its dimensions. A line layer is also known as a LineString. An example is this map showing South Australia's approximate land borders over the OSM basemap:
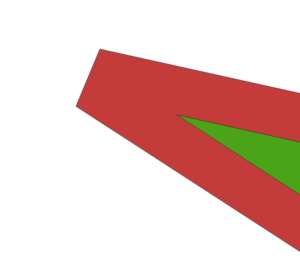
Self-intersecting lines
When drawing a line, if you intersect a part of the line you've previously drawn, you'll see a green cross over the intersection.
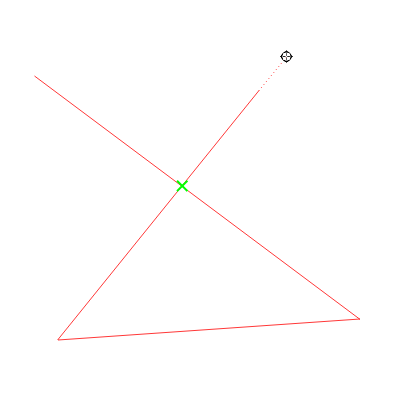
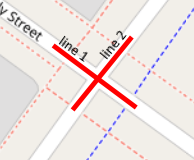
This can cause unexpected behaviours. If the lines you need to draw must intersect, for instance the roads of a real world intersection, it's best to draw multiple lines.
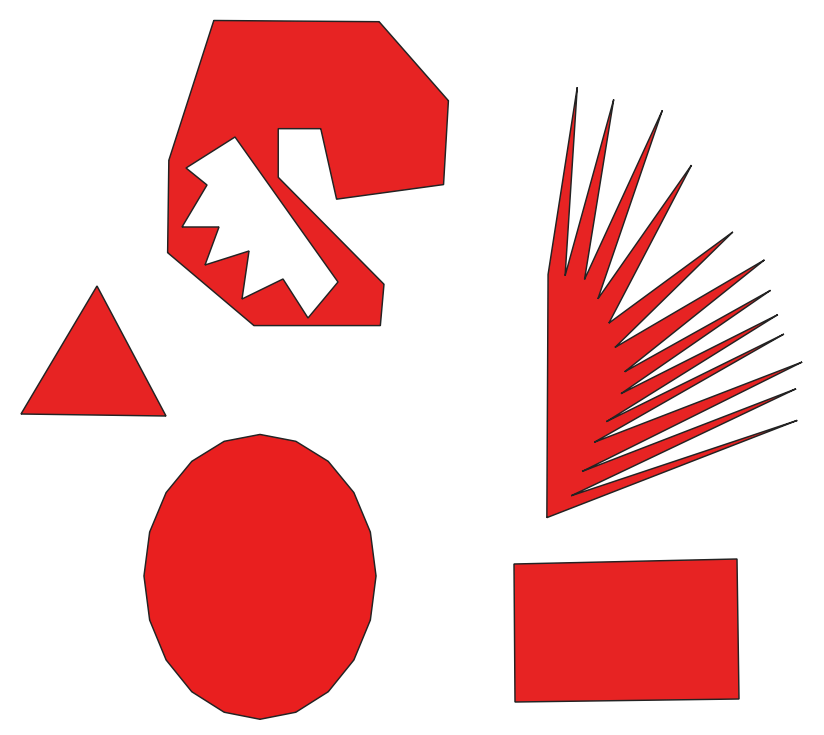
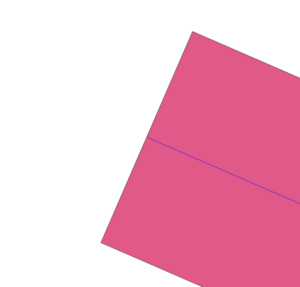
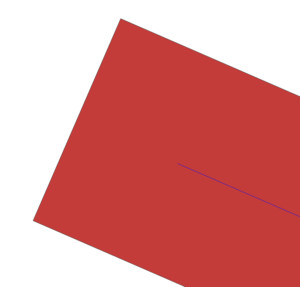
Polygon
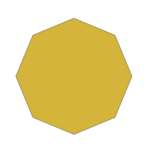
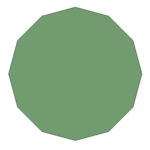
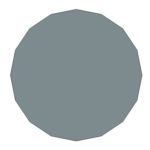
A polygon layer contains one or more closed shapes with at least 3 sides joined by points called vertices (singular: vertex). Somewhat confusingly, a polygon can also be referred to as a shape. Each of the examples below are valid polygons.
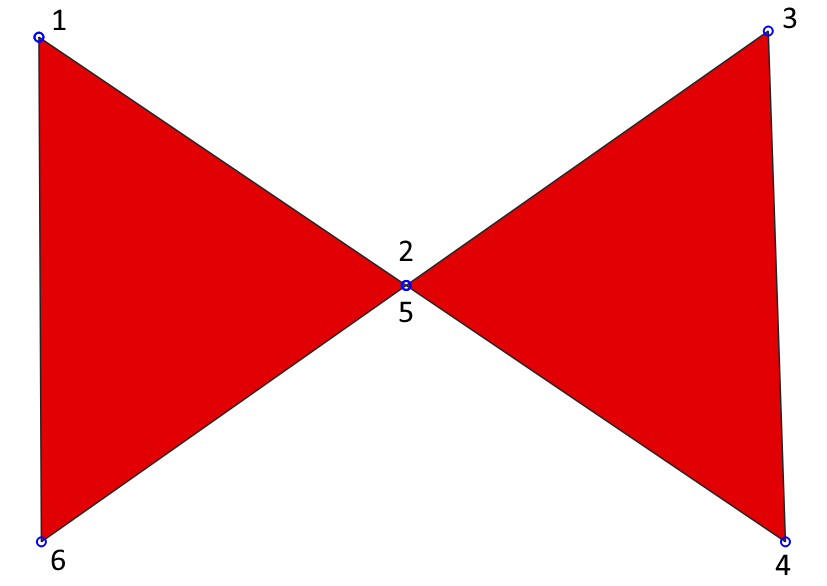
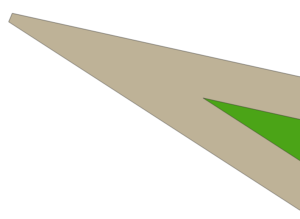
Invalid polygons
Much like self-intersecting lines, there are some polygon types which are invalid, and may cause unexpected behaviours. A classic example is the 'bowtie', the numbers below show the order in which the vertices were drawn.
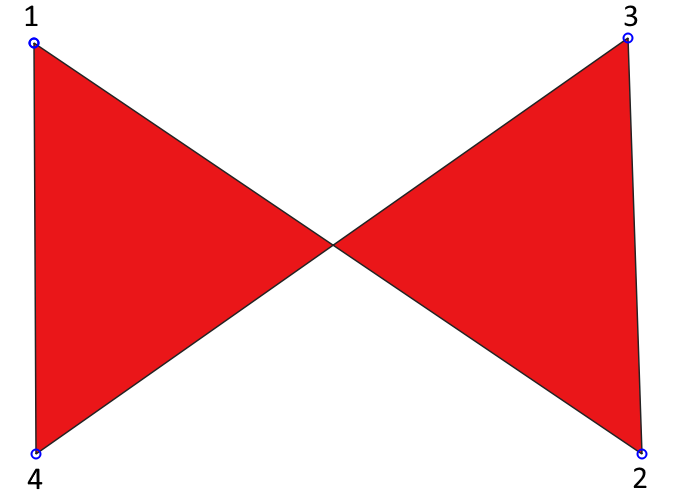
Geographic Information Systems (GIS) applications can deal with such shapes, but they must be drawn slightly differently and without intersections:
Scratch 
A scratch layer is like a draft. It is also called a temporary layer. Any of the previous layer types can be a scratch layer. A scratch layer is discarded when QGIS is closed, however you can convert it into a permanent file.
4. Typical scenarios
These examples go through the whole process of creating a shapefile for some typical situations. You'll need the OSM basemap; click and drag it into the Layers panel
Adding points
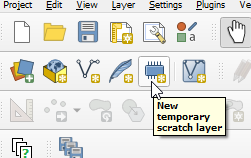
First click New temporary scratch layer.
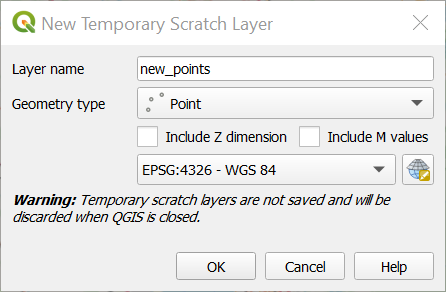
Give your layer a name, select Point from the Geometry type dropdown, and click OK.
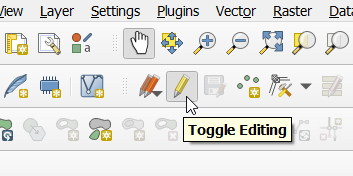
You may notice the pencil over the layer's point icon ![]()
This, and the button at the top, indicates that Toggle editing is enabled. This allows changes to be made to this layer.
Next click Add Point Feature:
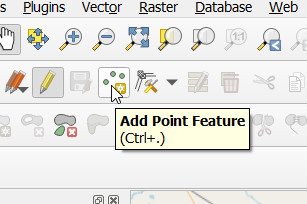
Now left click on the map to add a point. While editing mode is active, you can move the map around by clicking the scroll wheel and dragging your mouse. Once finished adding one or more points, click Toggle editing:
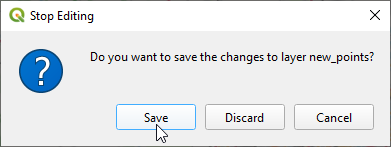
The Stop Editing prompt will appear, which asks you to save your changes. Click Cancel to continue adding points, otherwise click Save.
Now I have a scratch layer with several points on it.
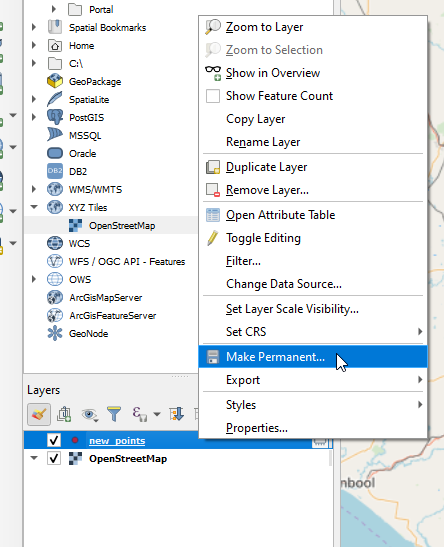
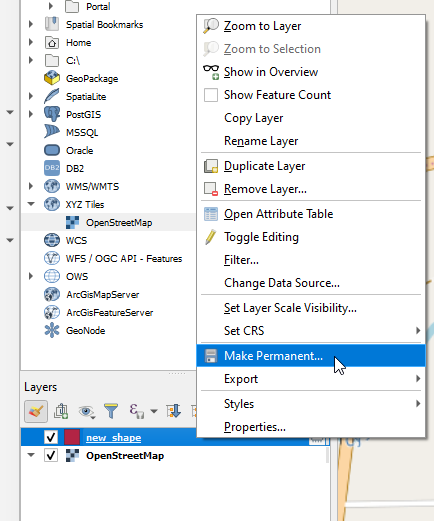
To convert the points layer to a permanent shapefile layer, first right-click the layer name, then click Make Permanent...
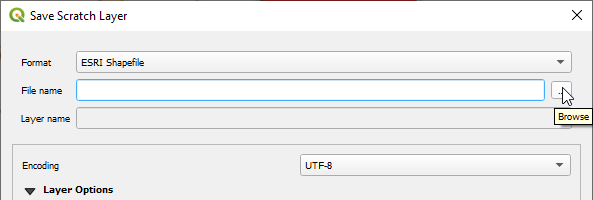
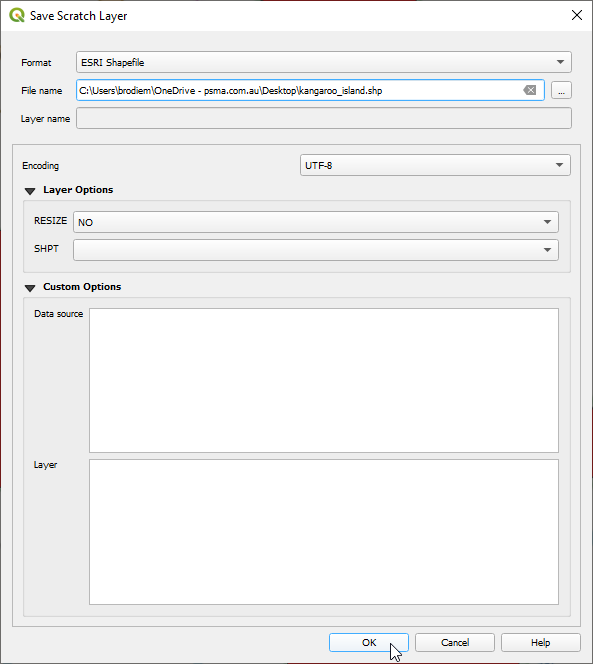
Ensure that ESRI Shapefile is selected in the Format dropdown. Now, click the Browse button to choose a save location and name for the shapefile.
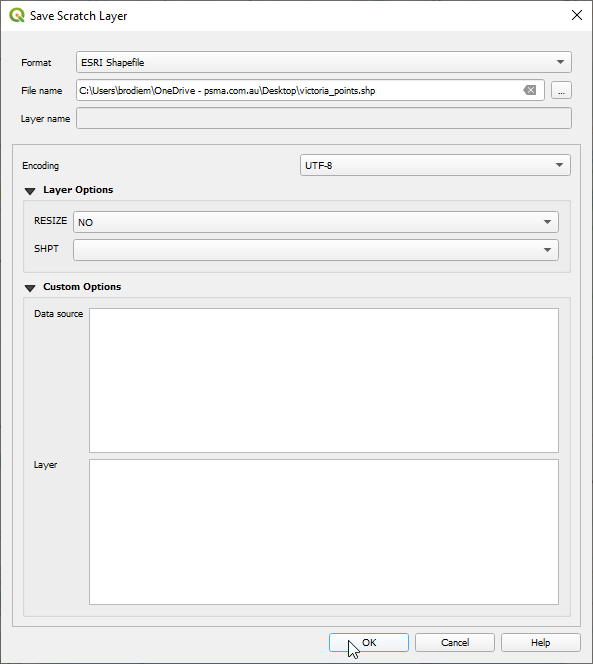
Once you've picked a file name and location, click OK:
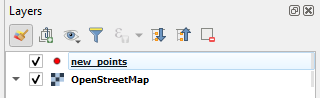
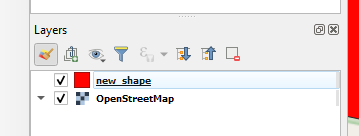
The Scratch layer icon is now no longer showing in the layer panel. Our Points layer is now a permanent file, which you can confirm in the Layers panel.
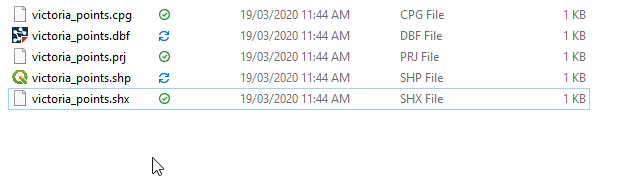
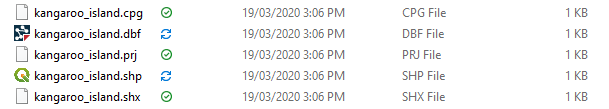
If I navigate to where I saved my shapefile, I can also see the saved files in my file explorer:
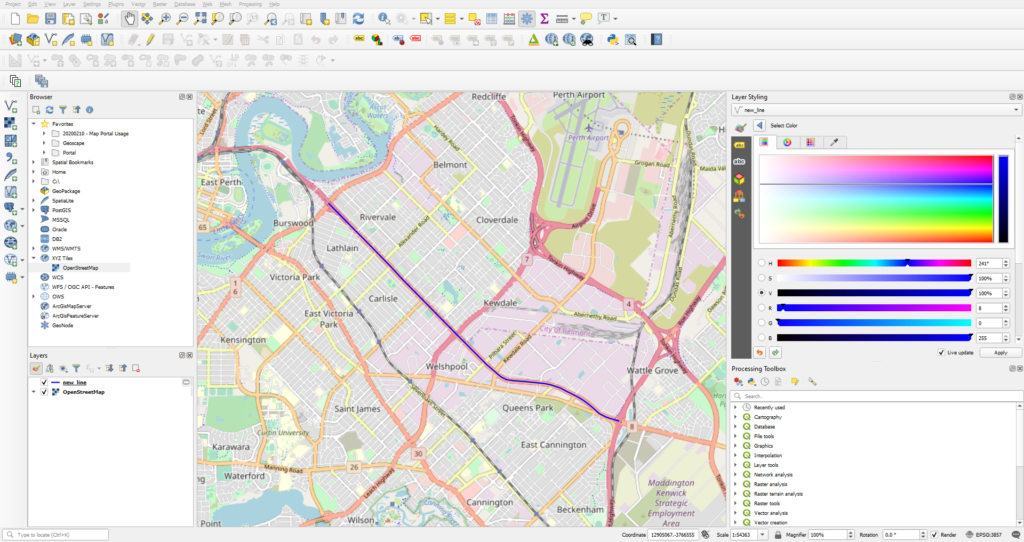
Tracing a road
First click New temporary scratch layer.
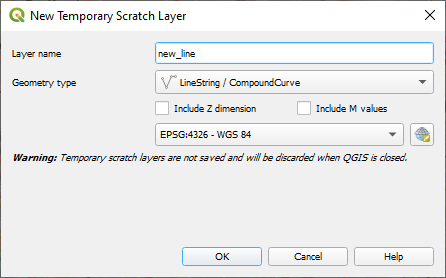
Give your layer a name, select LineString / CompoundCurve from the Geometry type dropdown, and click OK.
You may notice the pencil over the layer's line icon ![]()
This, and the button at the top toolbar, indicates that Toggle editing is enabled. This allows changes to be made to this layer.
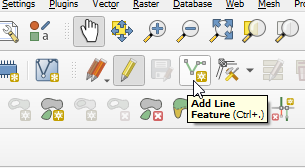
Next click Add Line Feature:
To place a vertex, left click somewhere on your basemap. The map can be moved around while editing by clicking the scroll wheel on your basemap and dragging your mouse.
Once finished with the line, right click anywhere on the basemap. You can begin drawing another line by left clicking again on the map, otherwise click Toggle Editing to stop editing the layer.
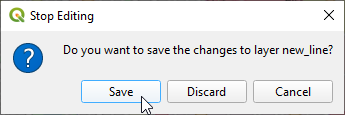
The Stop Editing prompt will appear, asking to save the changes. Click Cancel to continue adding lines, otherwise click Save.
Now I have a scratch layer with a line on it:
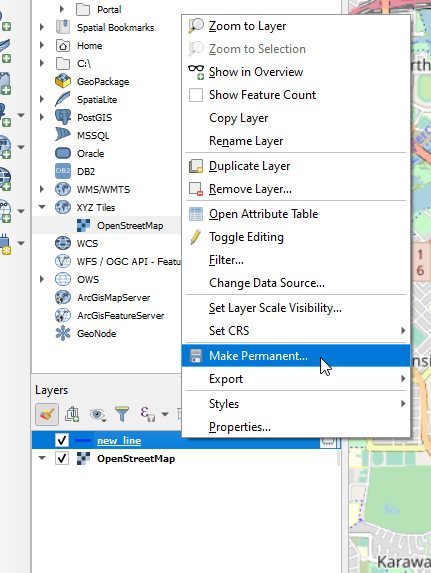
To convert the line layer to a permanent shapefile layer, first right-click the layer name, and then click Make Permanent...
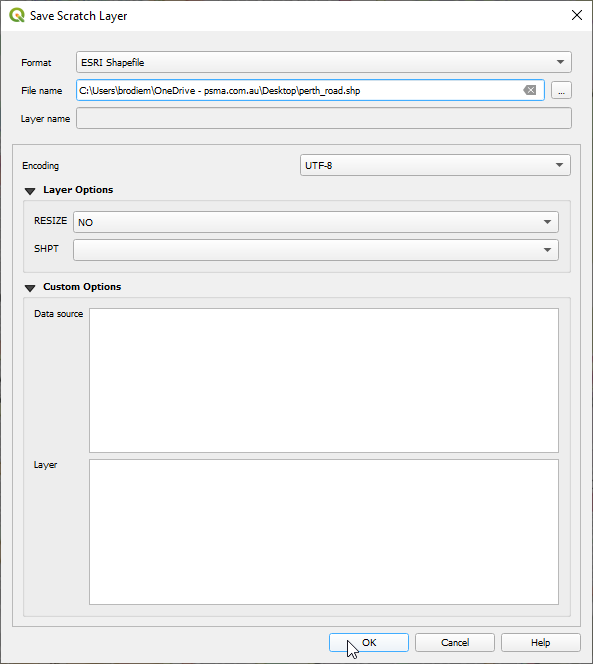
Ensure that ESRI Shapefile is selected in the Format dropdown. Now, click the Browse button to choose a save location and name for the shapefile.
Once you've picked a file name and location, click OK:
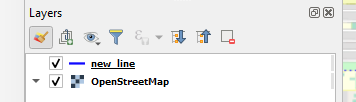
The Scratch layer icon is now no longer showing in the layer panel. Our line layer is now a permanent file, which you can confirm in the Layers panel.
If I navigate to where I saved my shapefile, I can also see the saved files in my file explorer:
Drawing a polygon
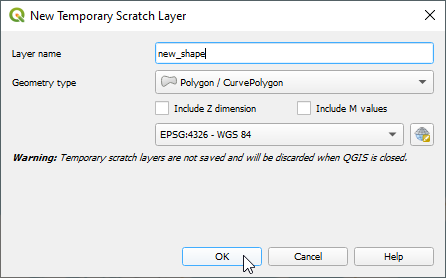
First click New temporary scratch layer.
Give your layer a name, select Polygon / CurvePolygon from the Geometry type dropdown, and click OK:
You may notice the pencil over the layer's polygon icon ![]()
This, and the button at the top toolbar, indicates that that Toggle editing is enabled. This allows changes to be made to this layer.
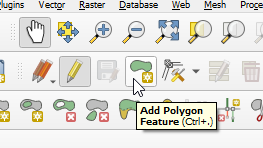
Next click Add Polygon Feature:
To place a vertex, left click on the basemap. You must use at least 3 vertices to create a polygon. You can move the map around while editing by clicking the scroll wheel and dragging your mouse. Once you've finished drawing the polygon, right click anywhere on the basemap. You can begin drawing another polygon by left clicking again on the map, otherwise click Toggle Editing to stop editing the layer.
The Stop Editing prompt will appear, asking to save the changes. Click Cancel to continue adding lines, otherwise click Save.
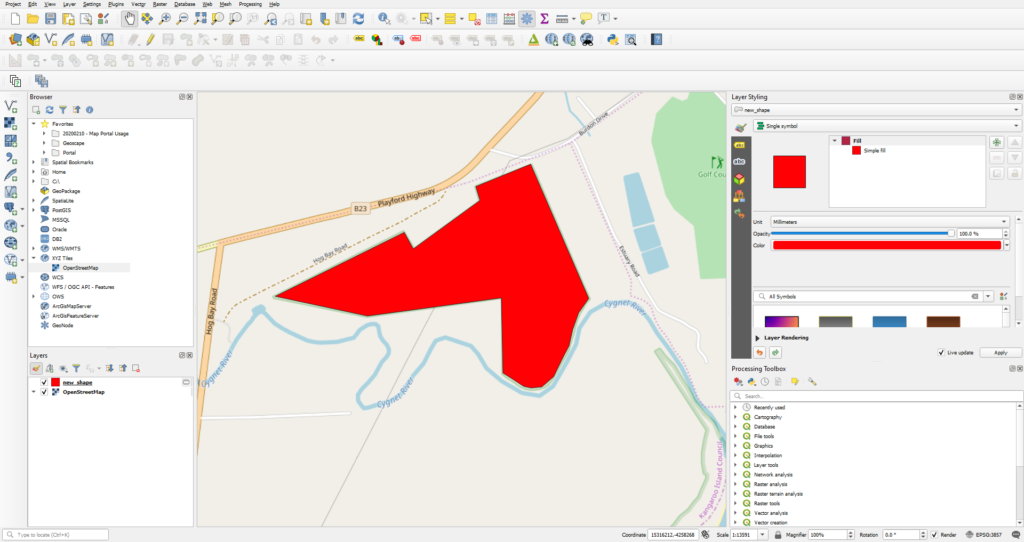
Now I have a scratch layer with a polygon on it.
To convert the line layer to a permanent shapefile layer, first right-click the layer name in the Layers panel, and then click Make Permanent...
Ensure that ESRI Shapefile is selected in the Format dropdown. Now, click the Browse button to choose a save location and name for the shapefile.
Once you've picked a file name and location, click OK
The Scratch layer icon is now no longer showing in the Layers panel. Our polygon layer is now a permanent file, which you can confirm in the Layers panel.
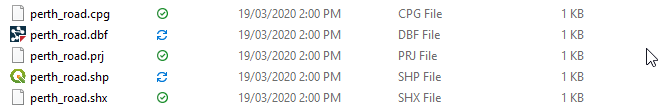
If I navigate to where I saved my shapefile, I can also see the saved files in my file explorer:
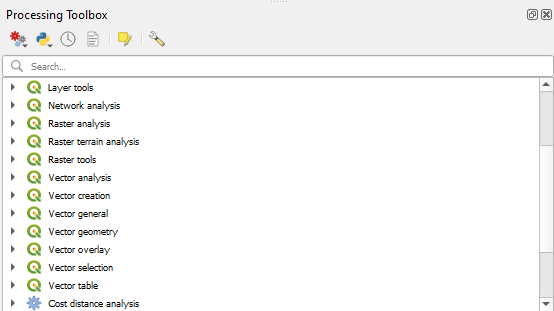
5. The processing toolbox
The Processing Toolbox allows you to perform a great variety of geospatial functions, we'll focus on a few that are particularly useful.
To open it, click on the Toolbox icon at the top toolbar.
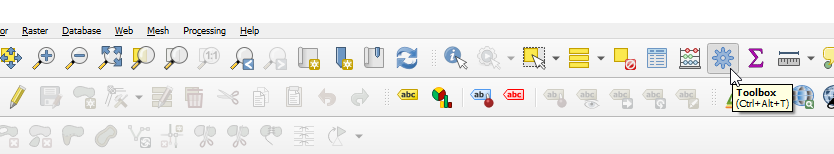
This will open the Processing Toolbox panel.
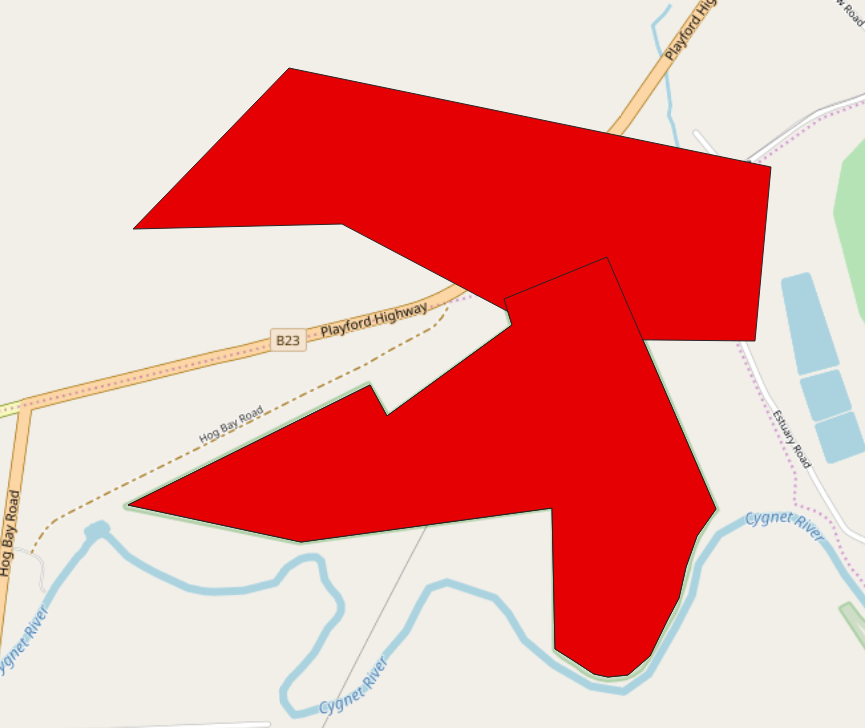
The dissolve tool
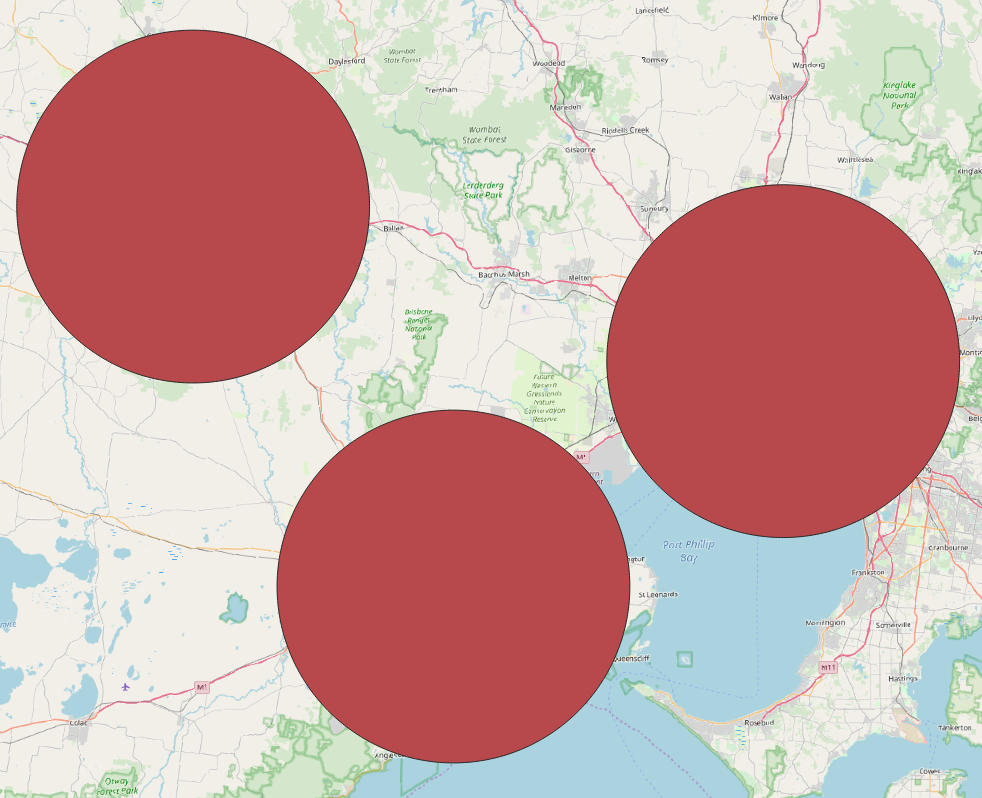
The dissolve tool allows you to remove the boundaries between connected or overlapping shapes within a layer. This effectively converts multiple overlapping shapes into a single contiguous shape. Here is an example of overlapped shapes:
In the Processing Toolbox panel, type 'dissolve' into the Search... box.
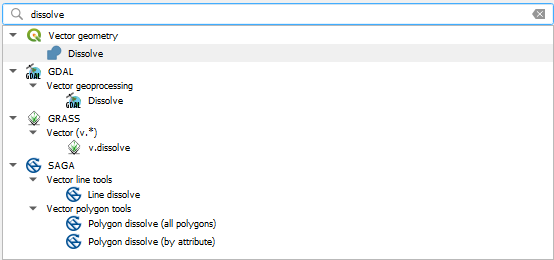
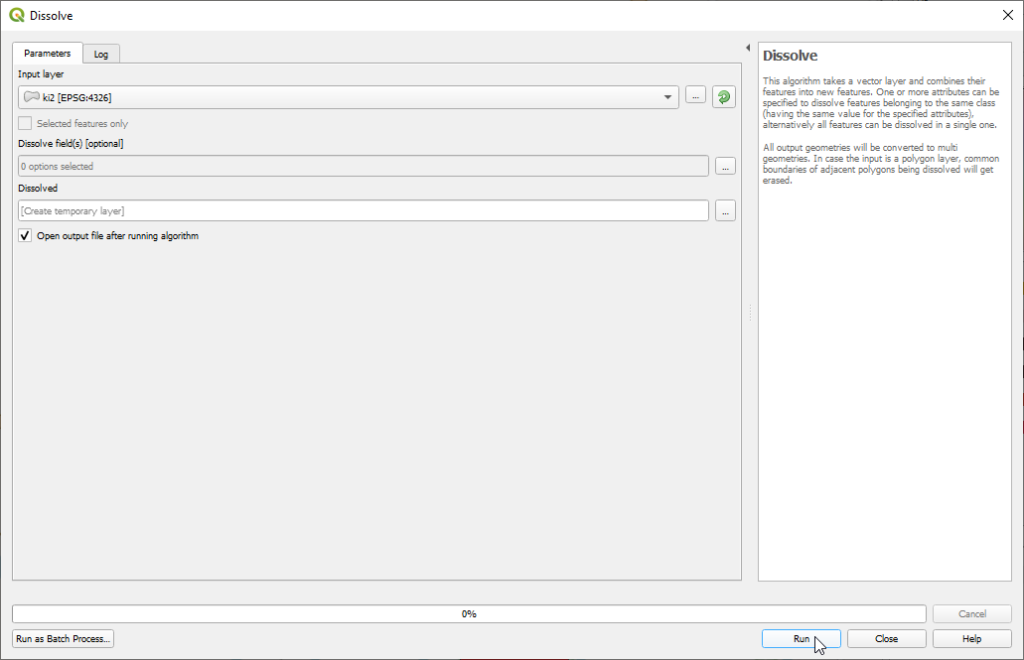
There are several related tools which have 'dissolve' in their name, double click the Dissolve function under Vector geometry (with the QGIS logo ![]() ), which will open the Dissolve window. Confirm the correct layer appears in the Input layer dropdown, then click Run
), which will open the Dissolve window. Confirm the correct layer appears in the Input layer dropdown, then click Run
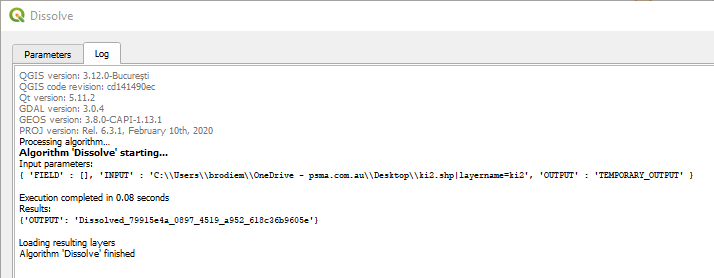
The Dissolve window will switch to the Log tab, which confirms that the process is complete. Once this appears, you can close the the Dissolve window.
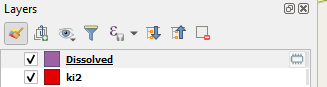
There is now a new scratch layer called Dissolved.
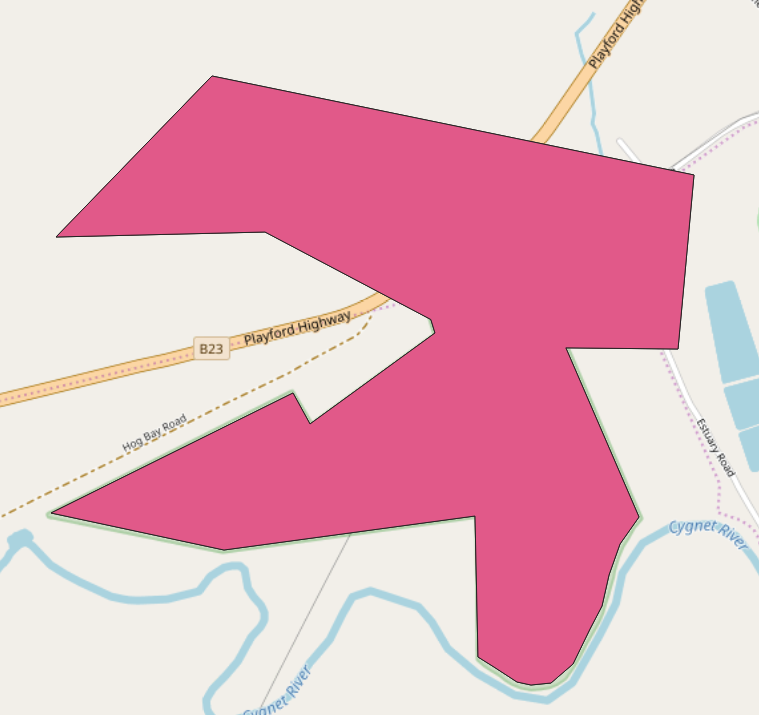
And the newly dissolved shape appears on the map.
Buffer tool and examples
A buffer extends the boundary of a shape by a defined amount. It's not simply resizing the shape, but using the shape as a starting point and expanding it. Using the shapes made in the last few examples, I'll show how different kinds of buffers work.
To access the buffer tool, type 'buffer' into the search bar of the Processing Toolbox panel:
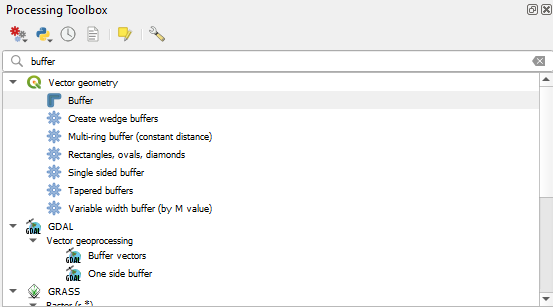
Then double click the Buffer function under Vector geometry(with the QGIS logo ![]() ), which will open the Buffer window.
), which will open the Buffer window.
Degrees instead of metres!
If you see this warning message, you'll need to take some additional steps before using the buffer tool.

Coordinate reference systems are beyond the scope of this guide. Suffice to say when working on an area, it's a good idea to use a projection designed specifically for that area. My points layer is set to EPSG: 4283 which is used for the entire world. I'll instead reproject the layer to a more suitable projection.
To do this, right click your layer, then choose Export and Save Features As...
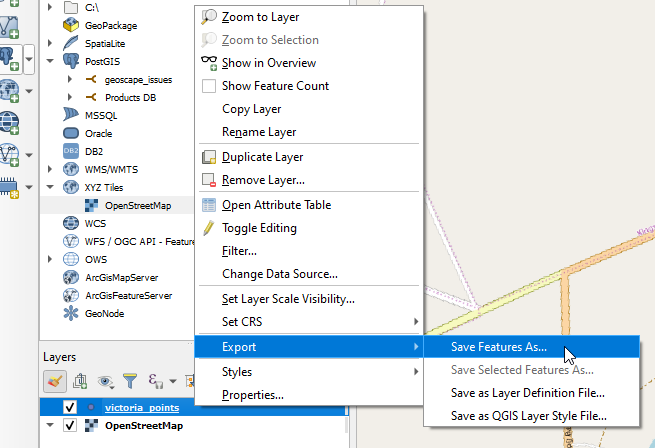
Click the ![]() icon next to CRS, which will open the Coordinate Reference System Selector window.
icon next to CRS, which will open the Coordinate Reference System Selector window.
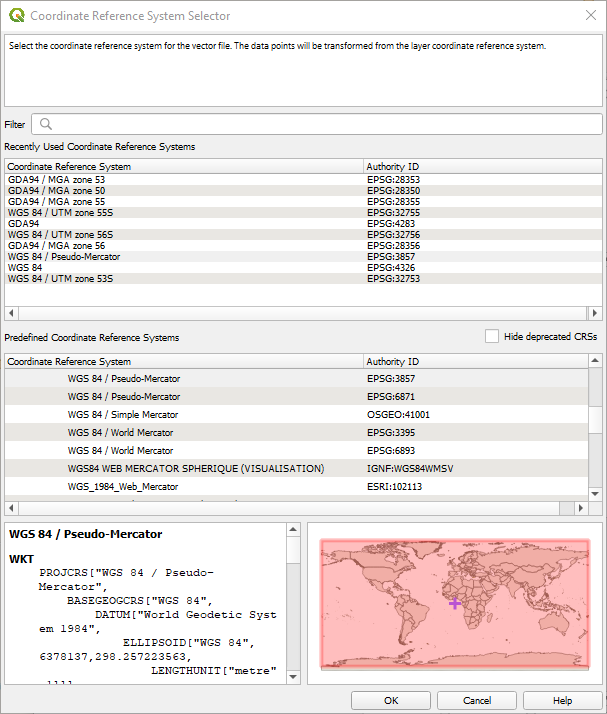
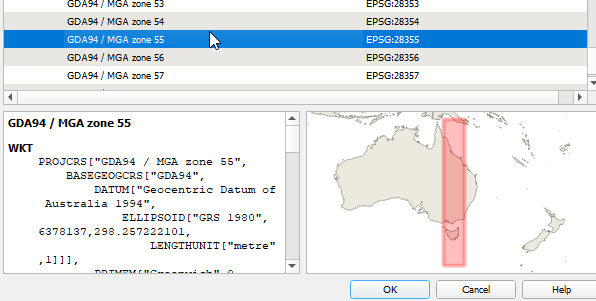
MGA zones are a good way to work on features in Australia. To find these type 283 in the Filter box of the Coordinate Reference System Selector. Click on one of the zones under Predefined Coordinate Reference Systems and the suitable area will display in red in the map view.
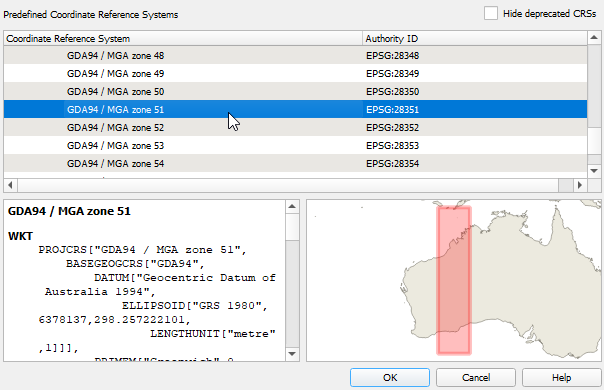
The area I'm using is in Melbourne, so I'll choose 28355 and click OK:
Next click the Browse icon next to File Name, and choose an appropriate name and file location to save in.
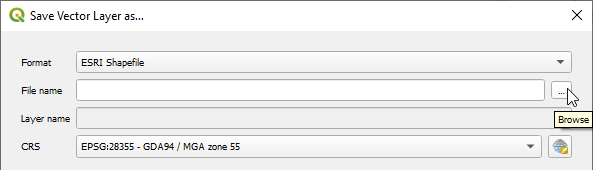
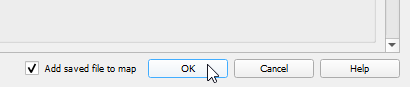
Once a name and location have been chosen, click OK, making sure Add saved file to map is ticked:
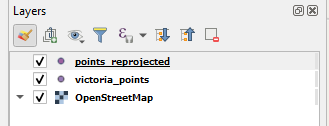
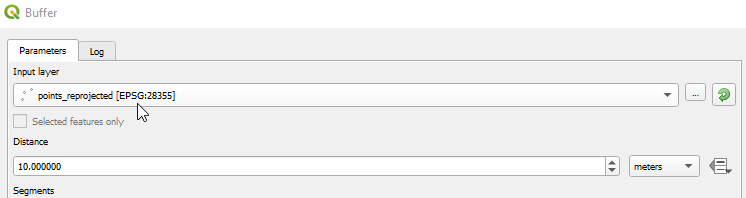
I now have an identical layer with the reprojected points:
And the warning about degrees doesn't show for this layer:
Buffering a point
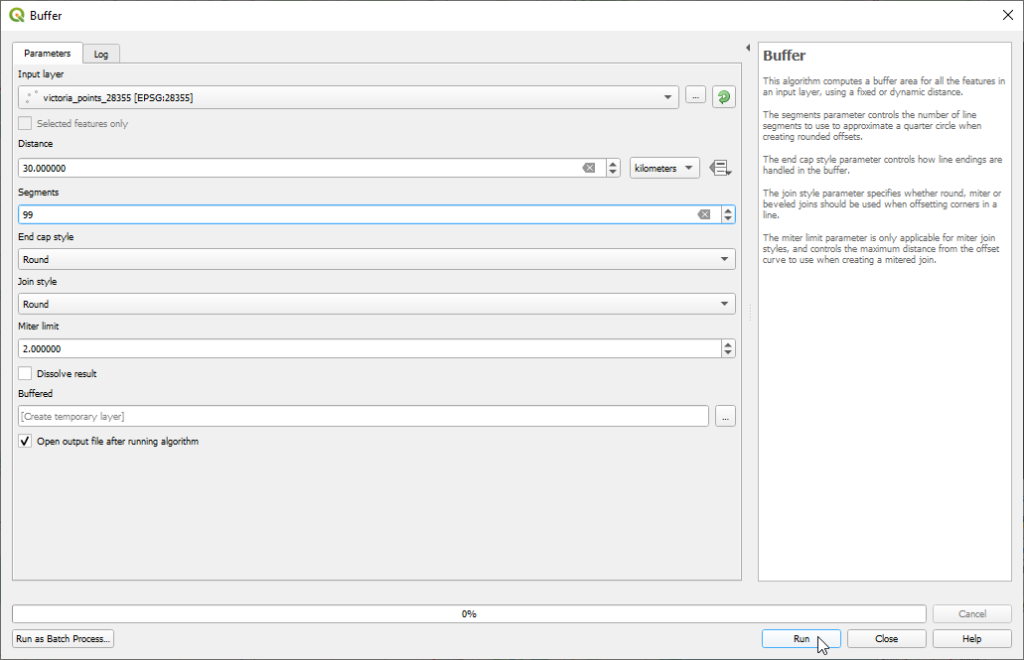
With each of my points as the centre, I'd like to see the area covered by a circle with a 30km radius. To achieve this, in the Distance field, type 30, and set the units dropdown from metres to kilometres. Then set Segments to 99 and click Run:
When the Buffer window switches to the Log tab, this indicates the process is complete. Once this appears you can close the Buffer window.
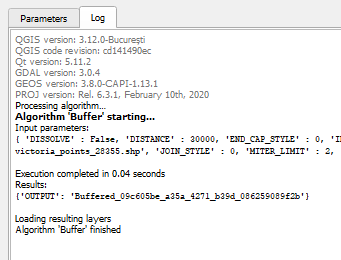
There is now a new scratch layer called Buffered.
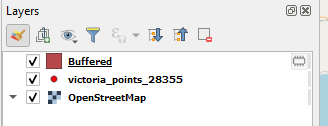
And the newly buffered shapes now appear on the map.
Dissolve and buffer
Dissolving a buffer can be helpful when buffering multiple items simultaneously.
If I were to make a 40km buffer around these points, the resulting shapes now overlap:
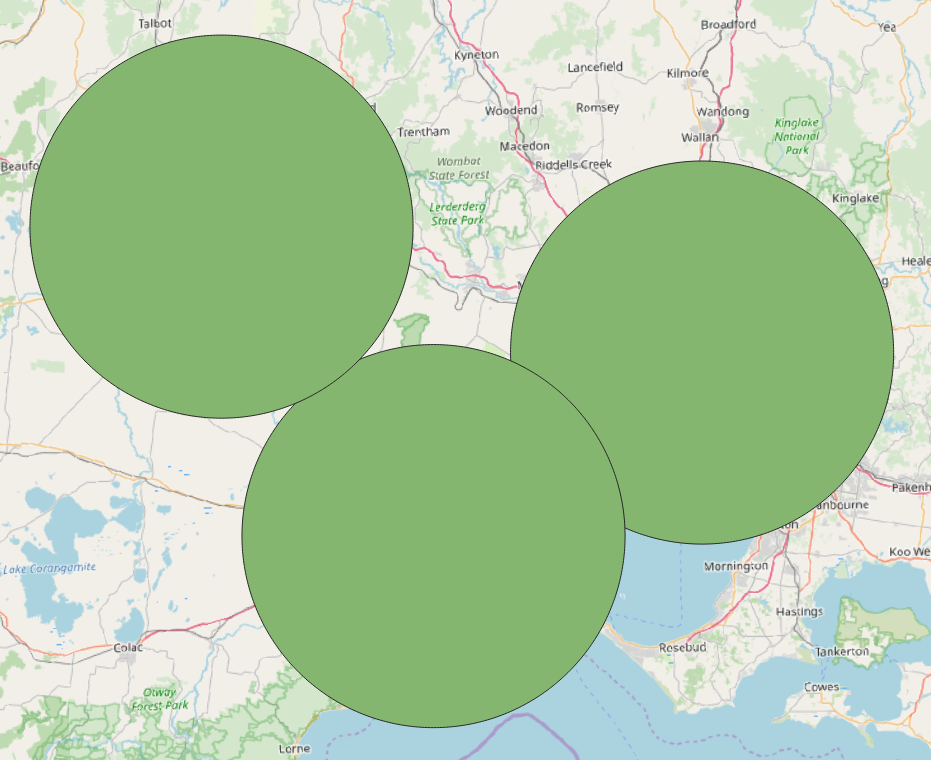
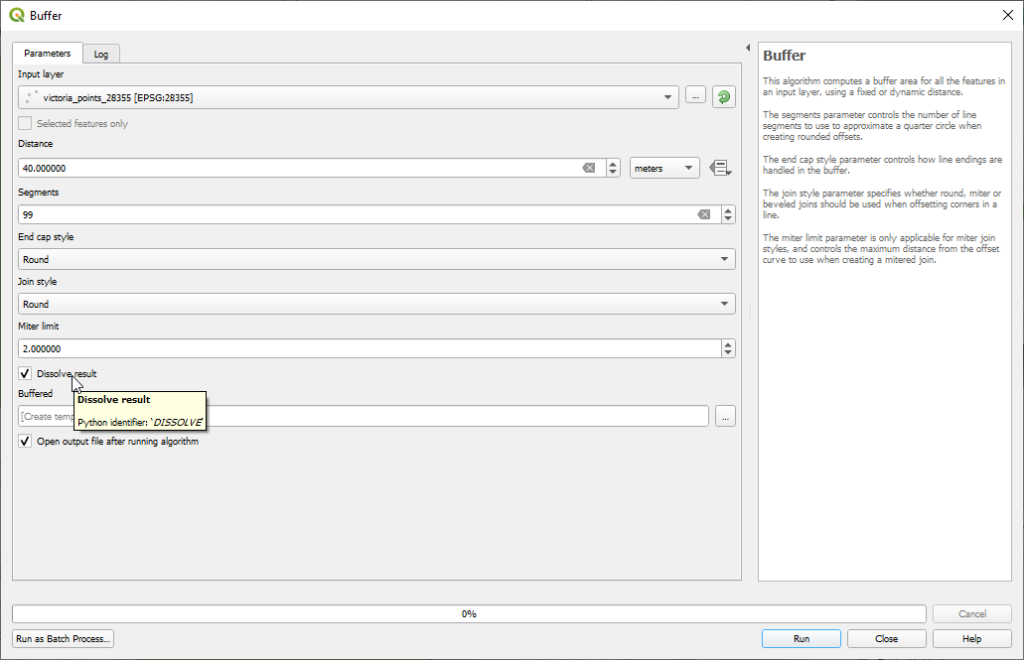
The output from buffering can be dissolved in another step, but we can save time by selecting Dissolve result:
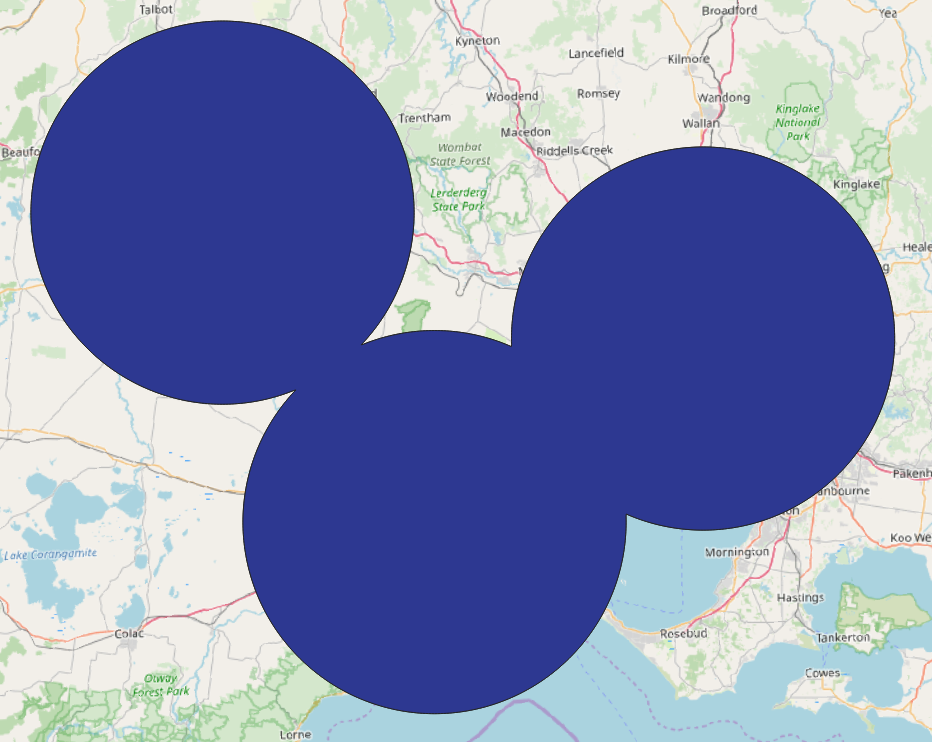
The resulting shape is now a single polygon:
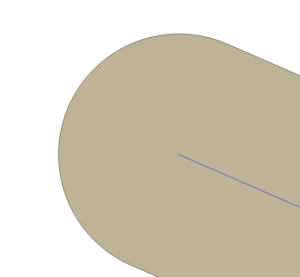
Buffering a line
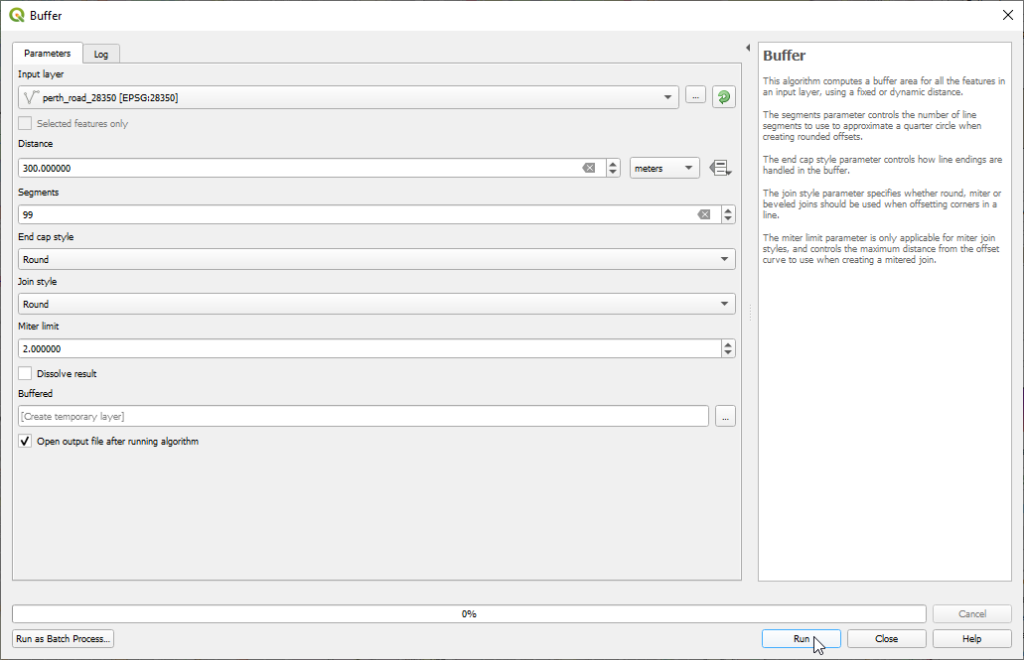
Using the line I drew over Perth to reflect a road, I'd like to see the area covered by a 300m buffer from the road. To achieve this, in the Distance field type 300. By default this should be set to metres. If not, change the unit to metres. Lastly set Segments to 99 then click Run:
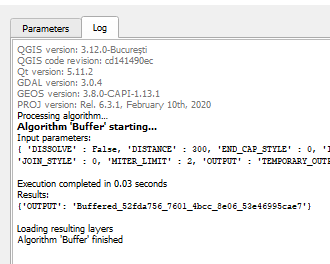
When the Buffer window switches to the Log tab, this indicates the process is complete. Once this appears you can close the Buffer window.
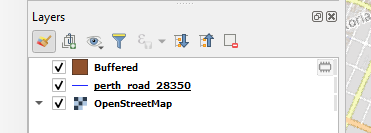
There is now a new scratch layer called Buffered:
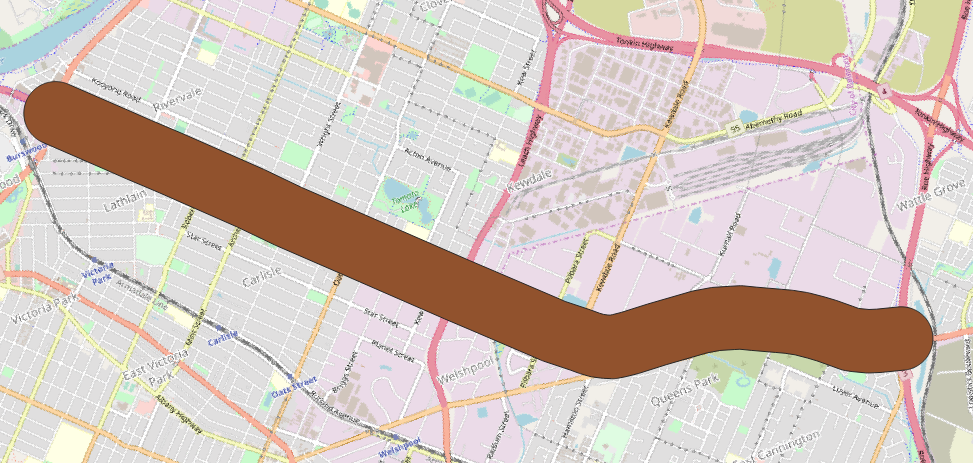
And the newly buffered shape now appears on the map.
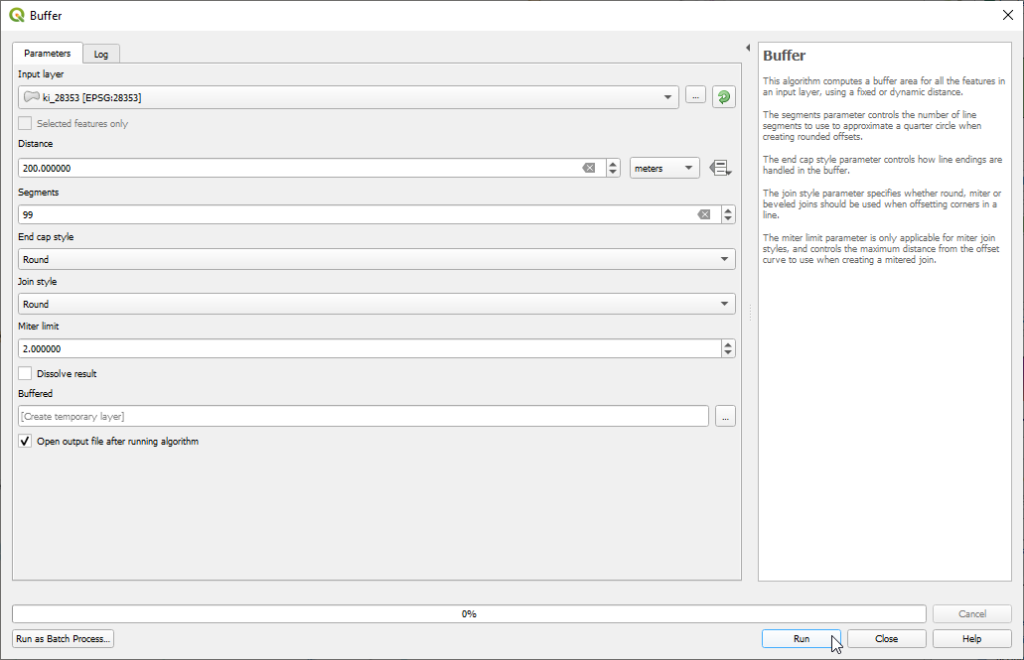
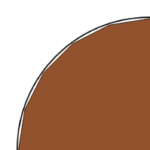
Buffering a polygon
Using the polygon I drew over Kangaroo Island, I'd like to see the area covered by a 200m buffer. To achieve this, in the Distance field type 200. By default the units should be set to metres. If not, change the units. Lastly set Segments to 99 then click Run:
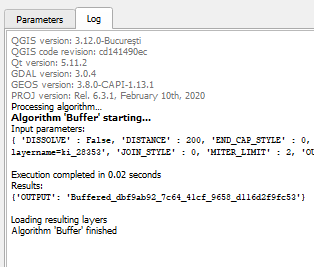
When the Buffer window switches to the Log tab, this indicates the process is complete. Once this appears you can close the Buffer window.
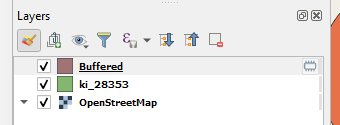
There is now a new scratch layer called Buffered:
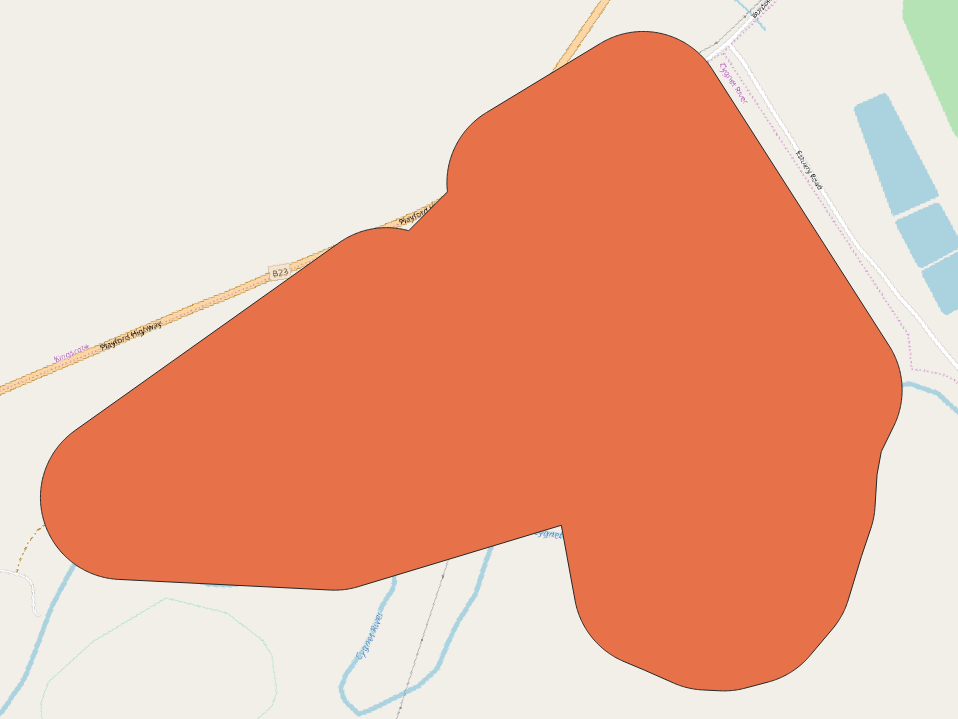
And the newly buffered shape now appears on the map.
Segments? End caps? Join styles? Miter limits?
Most of these settings will be unnecessary, however it's useful to understand them, especially segments. The following are examples to demonstrate the effects of these settings.
Segments
In QGIS, segments refers to the number of lines used to draw a quarter of a circle. Below are several examples showing what a circle would look like drawn with progressively more line segments:

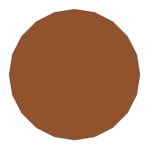
From left to right, these circles are drawn with 4 lines, 8 lines, 12 lines, 16 lines, and 20 lines.
QGIS asks for the number of line segments over a quarter of a circle. To understand this, we can look at a quarter of the above shapes with a conceptual perfect quarter circle overlaid.
From left to right, these quarter circles are drawn with 1 line, 2 lines, 3 lines, 4 lines, and 5 lines.
QGIS allows anywhere from 1-99 segments. For most cases 99 segments will be ideal.
End caps
End caps are the shape used by QGIS when buffering the end of a line. There are three options: round, flat and square.
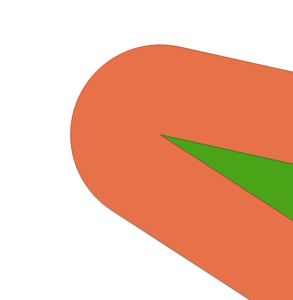
A round end cap adds a rounded section to the end of the buffer. The same rules about segments (see previous section) apply to a round end cap. Here's an example:
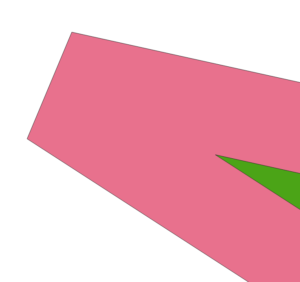
A flat end cap finishes the buffer exactly at the end of the line, there is an example below:
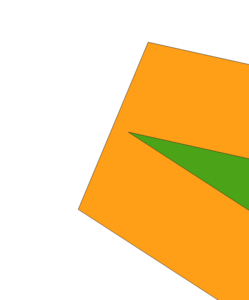
A square end cap adds a square-shaped section to the end of the buffer, here's an example:
Join Styles
QGIS has three options to draw corners when buffering a polygon: round, miter and bevel.
A round join style follows the same rules about segments mentioned in the previous section. It adds a round corner, as shown below:
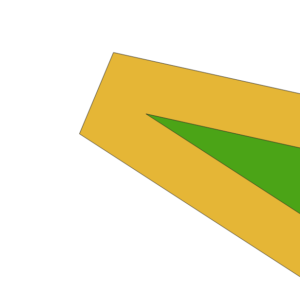
A miter join style adds additional space beyond the corner of the shape, and caps the end with a flat surface, as shown below:
The bevel join style takes the buffer drawn from each side of the shape, and adds a flat line on each corner to connect them, shown below:
Miter limit
This setting applies only when using the miter join style: it sets how long the miter will go beyond the corner of the shape.
From left to right, these show the miter limit set to 1, 2 and 5.